A scatterplot is used when there is a possibility of several semantic groupings. It can plot 2-D graph whose mapping can be enhanced by using some additional variables like hue, size and style parameters. These parameters are used to control visual semantics which can identify the different subsets.
Syntax
seaborn.scatterplot(x=None, y=None, hue=None, style=None, size=None, data=None,
palette=None, hue_order=None, hue_norm=None, sizes=None, size_order=None, size_norm=None,
markers=True, style_order=None, x_bins=None, y_bins=None, units=None, estimator=None, ci=95,
n_boot=1000, alpha=’auto’, x_jitter=None, y_jitter=None, legend=’brief’, ax=None, **kwargs)
Examples
import pandas as pd
import numpy as np
import matplotlib.pyplot as plt
import seaborn as sns


data=sns.load_dataset('iris')
data.shape
Output:
(150, 5)
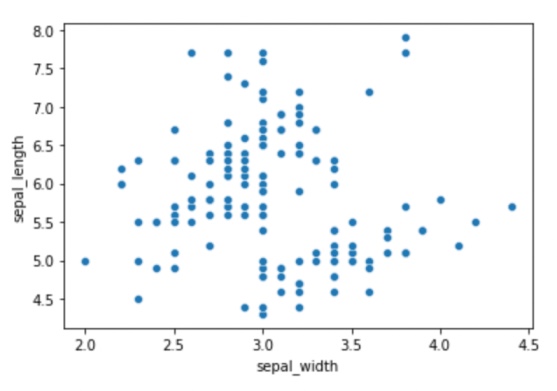
#simple scatterplot
sns.scatterplot(y='sepal_length',x='sepal_width',data=data)
Output:
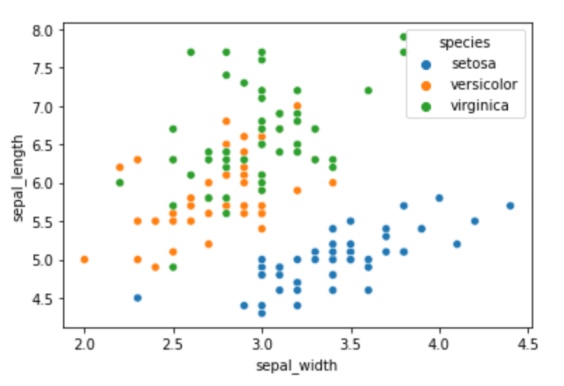
#using hue
sns.scatterplot(y='sepal_length',x='sepal_width',hue='species',data=data)
Output:
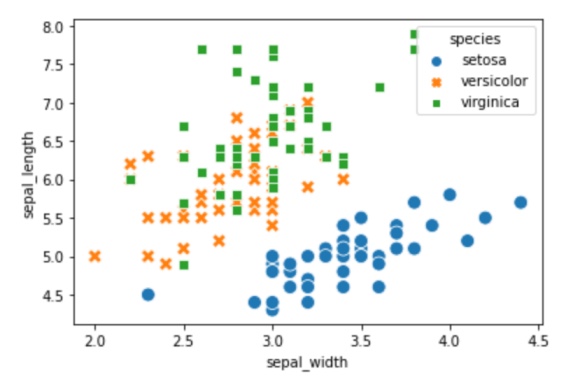
#styling
sns.scatterplot(x='sepal_width', y='sepal_length', hue='species', style='species',
data=data, s=100)
Output:
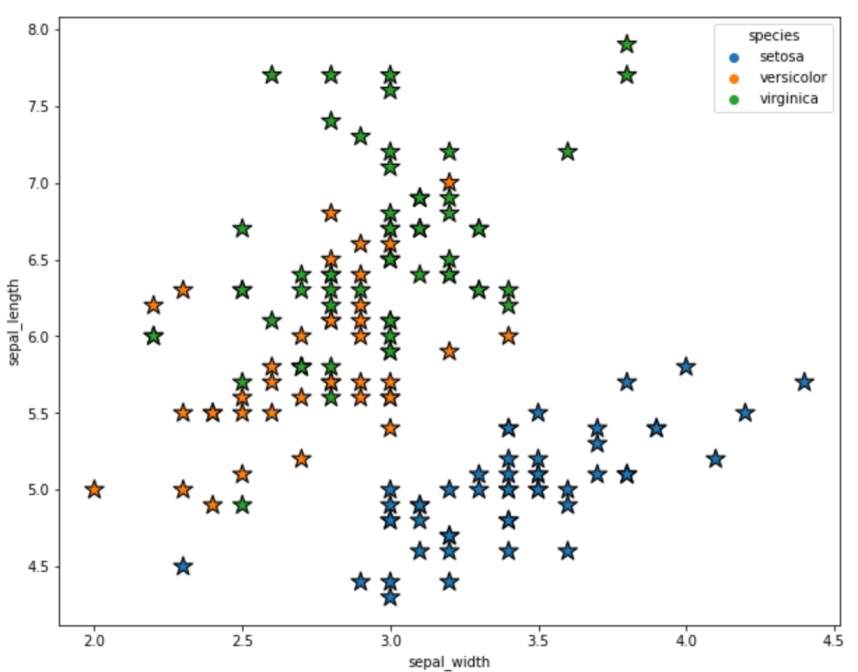
plt.figure(figsize=(10,8))
sns.scatterplot(x='sepal_width', y='sepal_length', hue='species',data=data,s=200,
marker='*',edgecolor='black')
Output:
- Log in to post comments