Strip plot can be plotted like a scatter plot where one variable is a categorical value. It is also a good alternative for scatter plots when we need to plot overlapping data points in observation because a scatter plot in the case of 2 similar data points are superimposed and in a strip plot, the values are juxtaposed where the jitter argument is True.
It is a graphical data analysis technique for summarizing a univariate dataset.
It is also a good complement to the box or violin plot because in the strip plot all the observations are shown along with some representation of the underlying distribution.
Syntax
seaborn.stripplot(*, x=None, y=None, hue=None, data=None, order=None,
hue_order=None, jitter=True, dodge=False, orient=None, color=None, palette=None,
size=5, edgecolor='gray', linewidth=0, ax=None, **kwargs)
Parameters
- x, y, hue: It is a parameter that is used for long-from of data input.
- data: It takes datasets for plotting.
- order, hue_order: It is the order to plot the categorical levels in.
- jitter: It is the amount of jitter to apply along the categorical axis only.
- orient: Orientation of the plot along the vertical or horizontal axis.
Examples
import pandas as pd
import numpy as np
import matplotlib.pyplot as plt
import seaborn as sns

data=sns.load_dataset('geyser')
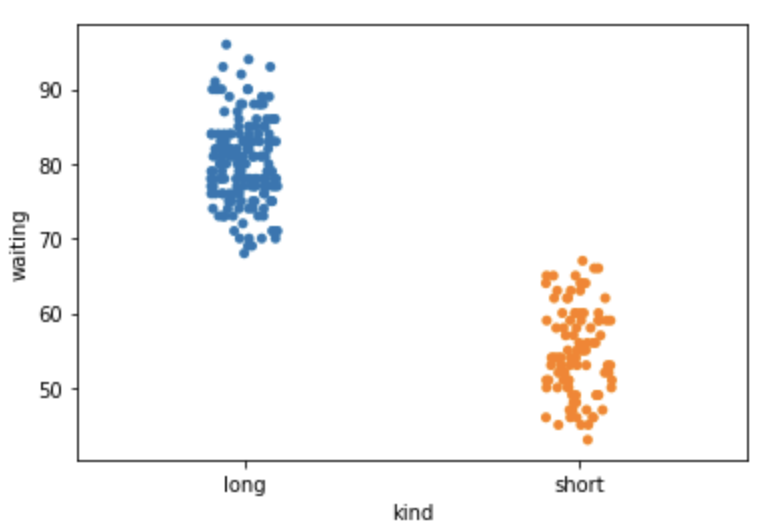
#Create a simple STRIP PLOT
sns.stripplot(x='kind',y='waiting',data=data)
Output
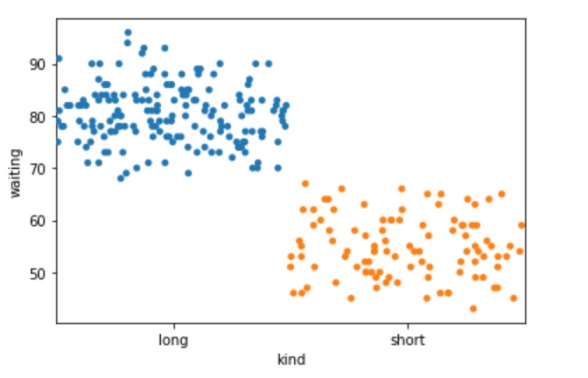
#using jitter
sns.stripplot(y='waiting',x='kind',data=data, jitter=0.5)
Output
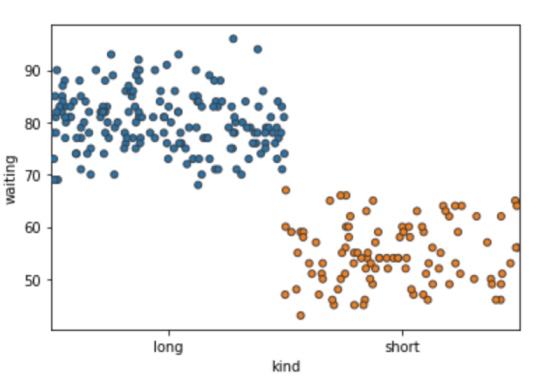
#draw the line around the point using line width
sns.stripplot(y="waiting", x="kind", data=data,linewidth=1,jitter=0.5)
Output
# simple scatter plot
sns.scatterplot(x='kind',y='waiting',data=data)
Output
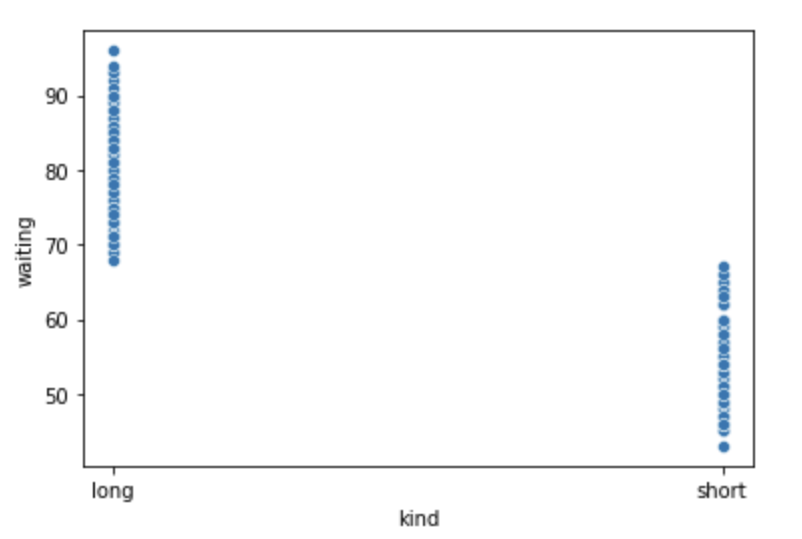
In the above example, you can see the difference between a scatter and a strip plot. Strip plot has avoided the overlapping of two same data points in the observation and scatter plot has superimposed them.
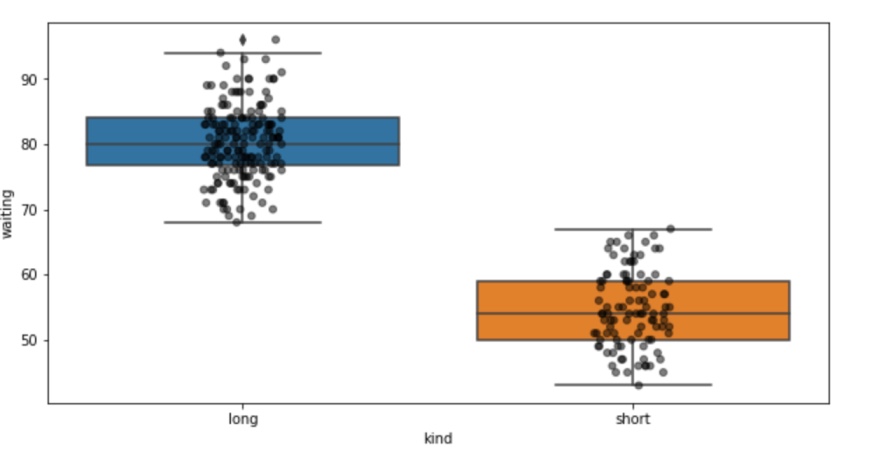
Strip Plot with Box Plot
#strip plot with boxplot
plt.figure(figsize=(10,5))
sns.boxplot(y='waiting', x='kind', data=data)
sns.stripplot(y='waiting', x='kind', data=data,color='black',alpha=0.5,linewidth=1)
Output
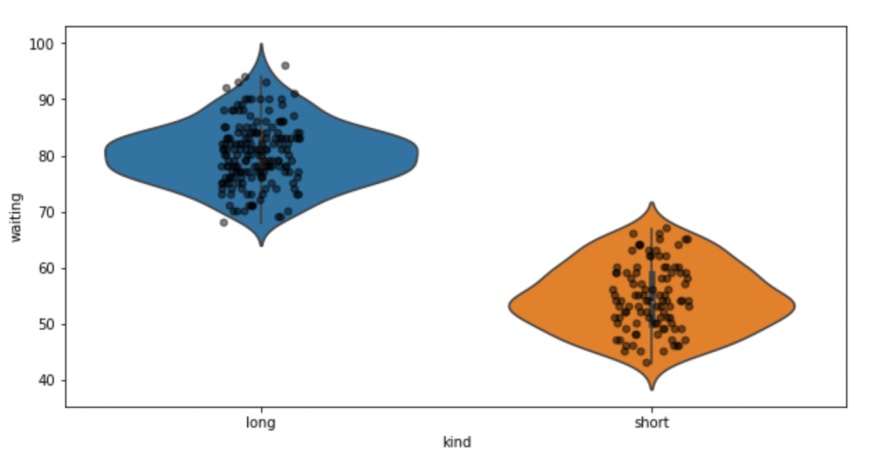
Strip Plot with Violin Plot
plt.figure(figsize=(10,5))
sns.violin(y='waiting', x='kind', data=data)
sns.stripplot(y='waiting', x='kind', data=data,color='black',alpha=0.5,linewidth=1)
Output
- Log in to post comments