Relational Plot is also known as Rel Plot. It is used for visualizing the statistical relationship between the data points.
Visualization of data is important to see trends and patterns in the data. This plot provides us with access to other different axes-level functions which can show the relationship between two variables with the help of semantic mappings of subsets.
Rel Plot is built on top of Facet Grid.
Syntax
seaborn.relplot(*, x=None, y=None, hue=None, size=None, style=None, data=None, row=None,
col=None, col_wrap=None, row_order=None, col_order=None, palette=None, hue_order=None,
hue_norm=None, sizes=None, size_order=None, size_norm=None, markers=None, dashes=None,
style_order=None, legend='auto', kind='scatter', height=5, aspect=1, facet_kws=None,
units=None, **kwargs)
Parameters:
- x, y: It is used for the input of data variables.
- hue: It is used for grouping variables that will produce elements with different types of colors.
- kind: It defines the type of plot, either scatterplot() or lineplot().
- row, col: It defines subsets to plot on different facets.
- aspect: It defines the ratio of each face.
- col_wrap: It wraps the column variable at the width, so the column facets span multiple rows.
Examples
import seaborn as sns
from matplotlib import pyplot as plt

data=sns.load_dataset('penguins')
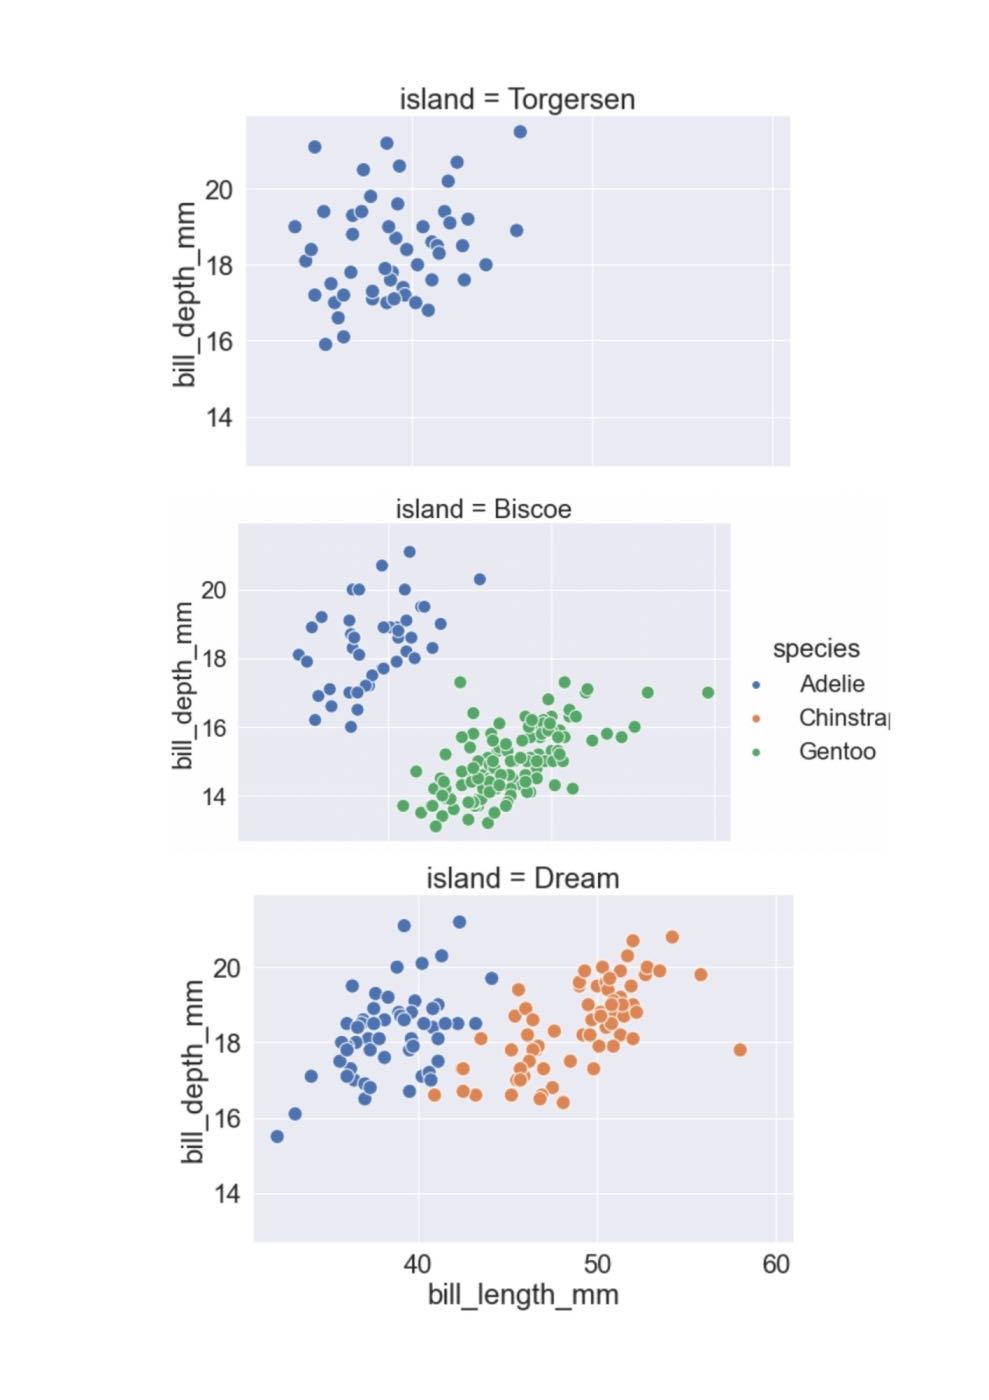
sns.relplot(x='bill_length_mm', y='bill_depth_mm', data=data,row='island',hue='species',
aspect=1.5, s=150)
Output
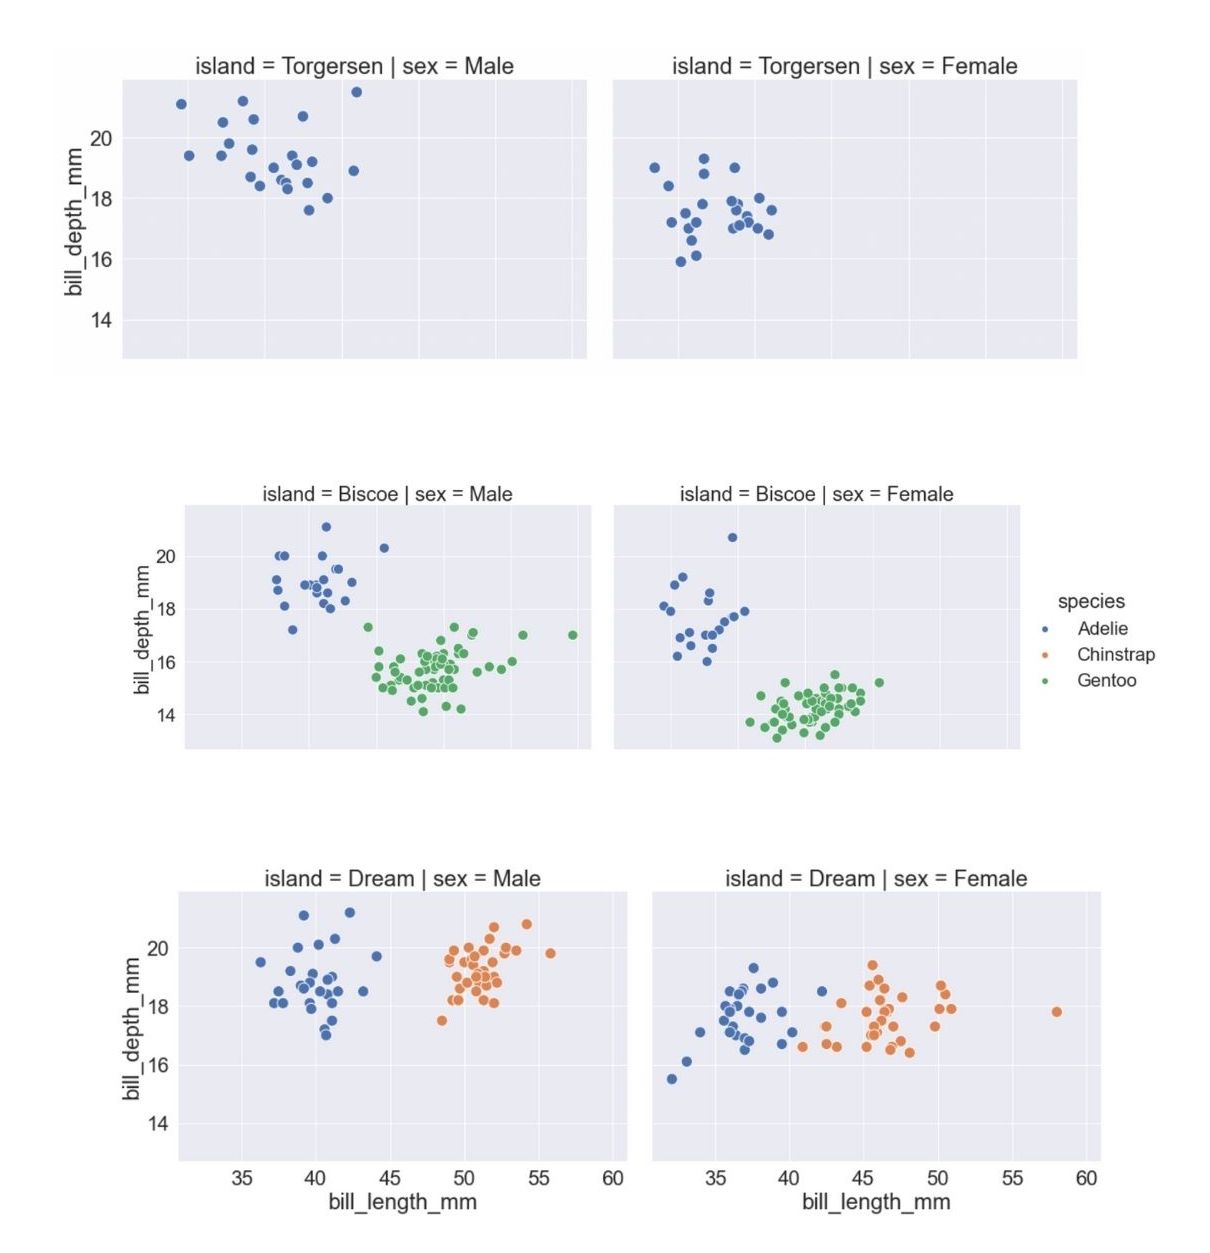
sns.relplot(x='bill_length_mm', y='bill_depth_mm', data=data,row='island',col='sex',hue='species', aspect=1.5,s=150)Output
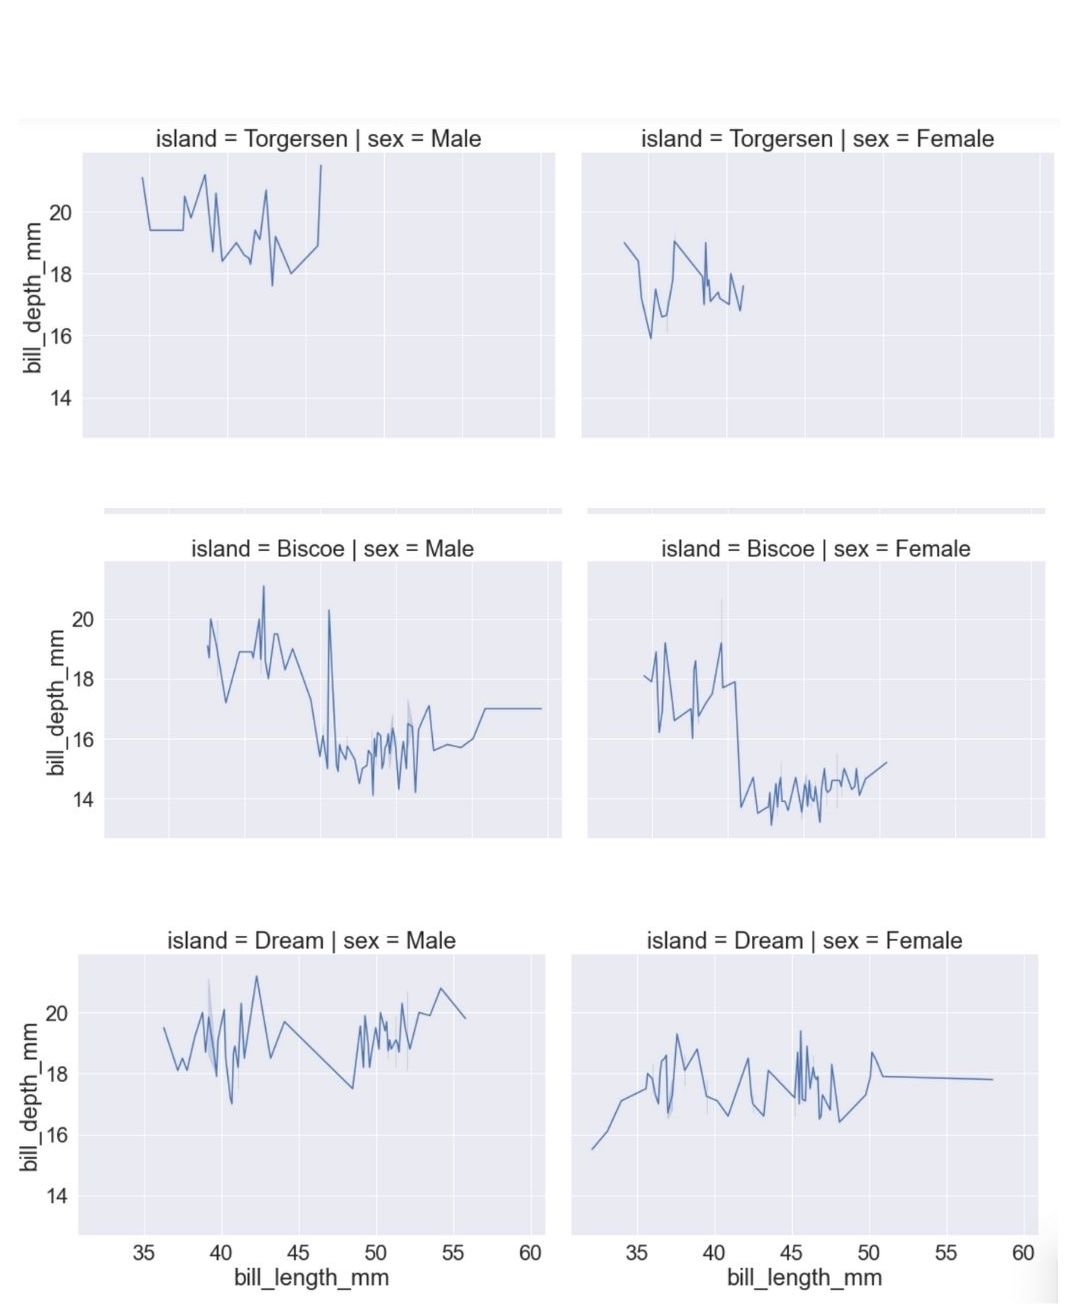
sns.relplot(x='bill_length_mm', y='bill_depth_mm', row='island',col='sex', data=data,aspect=1.5, kind='line')Output
- Log in to post comments