catplot() stands for Categorical Plot.
Catplot() function is used to work on categorical data. It was basically built on factorplot() function which was present in recent versions of the seaborn module.
As we know that there are a number of axes-level functions for plotting categorical data in different ways and a figure-level interface, catplot(), that gives unified higher-level access to them.
By default for data representation catplot() uses a scatterplot. There are two types of different categorical plots that take different approaches to represent categorical data with a scatter plot in which all the points which belong to the same category will fall in the same position along the axis corresponding to the categorical variable.
This approach is used by stripplot() which is by default "kind" in catplot(). It can also adjust the positions of points on the axis using "jitter".
And the second approach is to adjust the points along the categorical axis using an algorithm that will prevent the overlapping of the points. It will give us a better representation of the distribution of observations. This kind of plot is known as “beeswarm” and in seaborn, it is used as swarmplot() , which is can be used by setting kind="swarm" in catplot().
Syntax
seaborn.catplot(*, x=None, y=None, hue=None, data=None, row=None, col=None, kind=’strip’,
color=None, palette=None, **kwargs)
Examples
import seaborn as sns
from matplotlib import pyplot as plt
# import the dataset and drop the null values
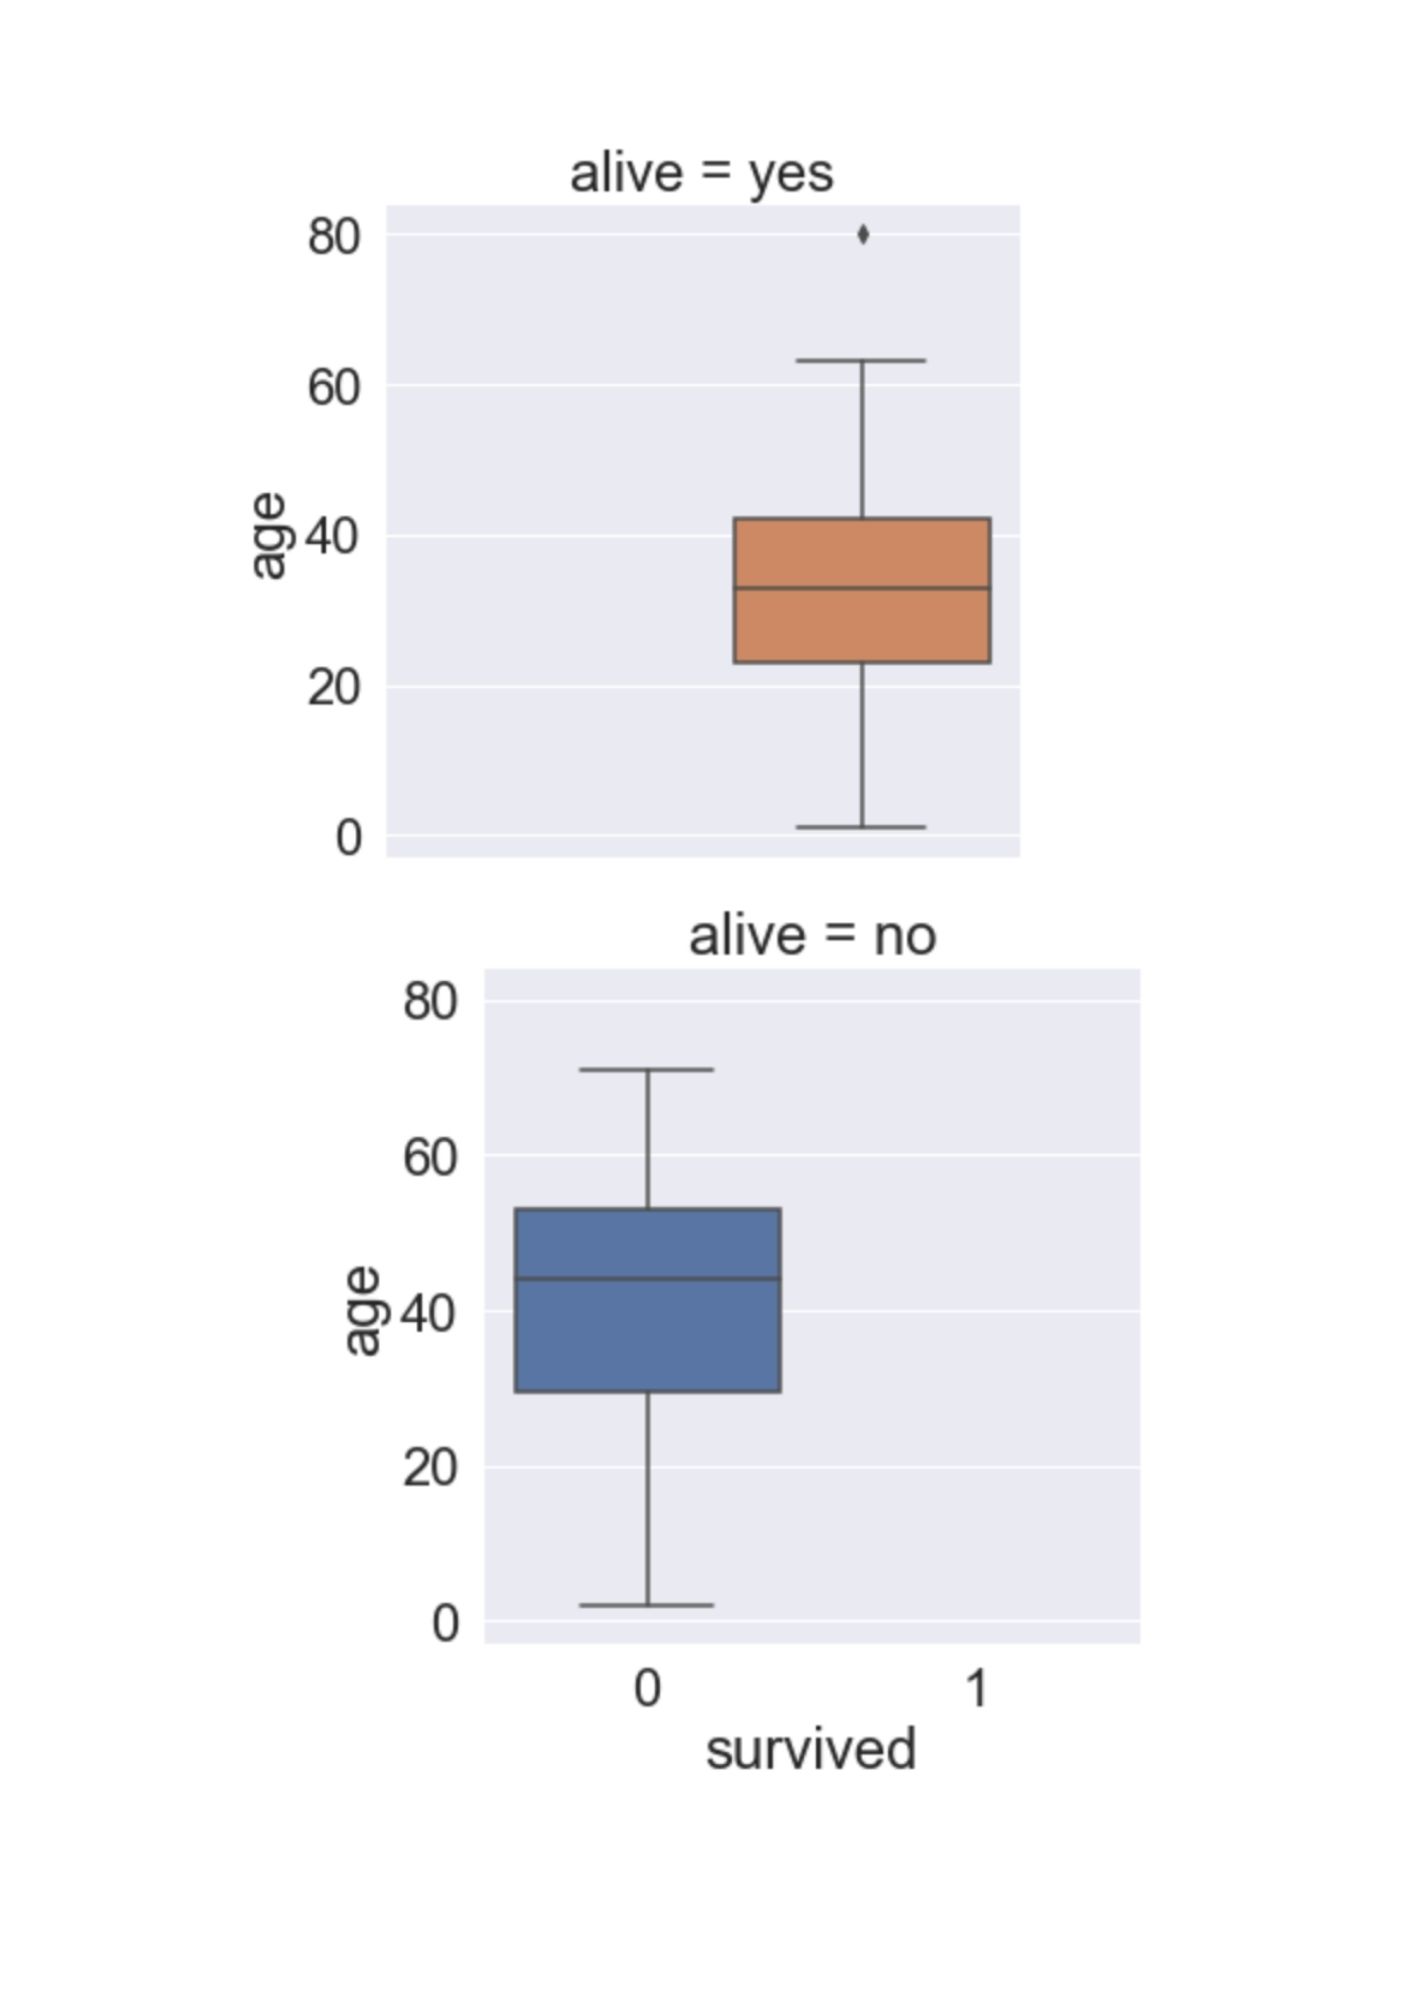
titanic=sns.load_dataset('titanic').dropna()Catplot() with kind set to box plot
sns.catplot(x='survived', y='age', data=titanic, row='alive',kind='box')Output
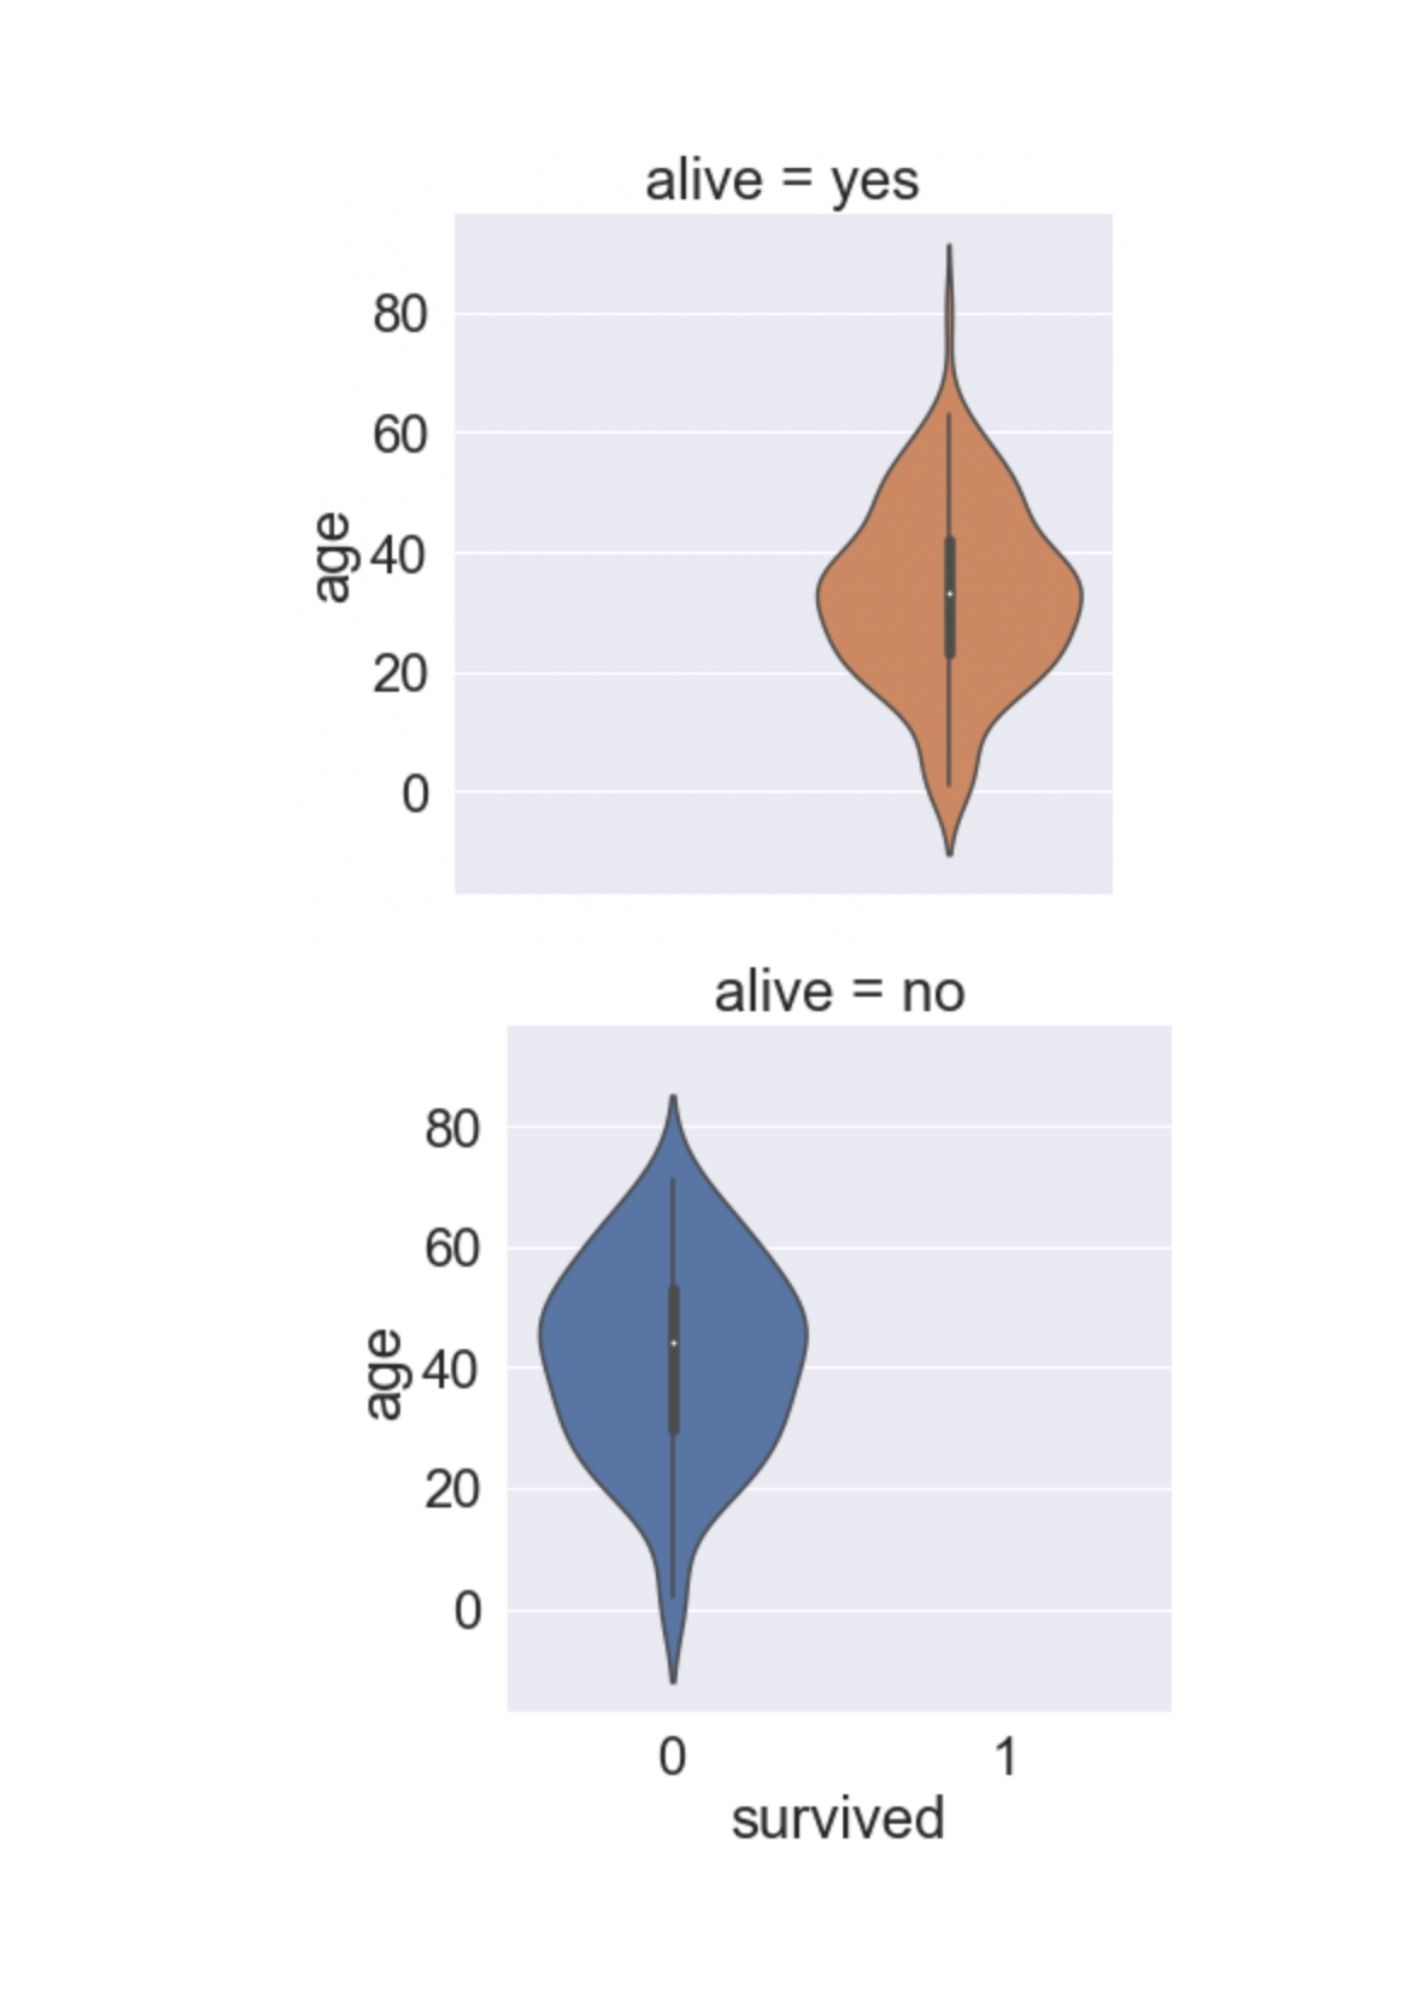
Catplot() with kind set to violin plot
sns.catplot(x='survived', y='age', data=titanic, row='alive', kind='violin')Output
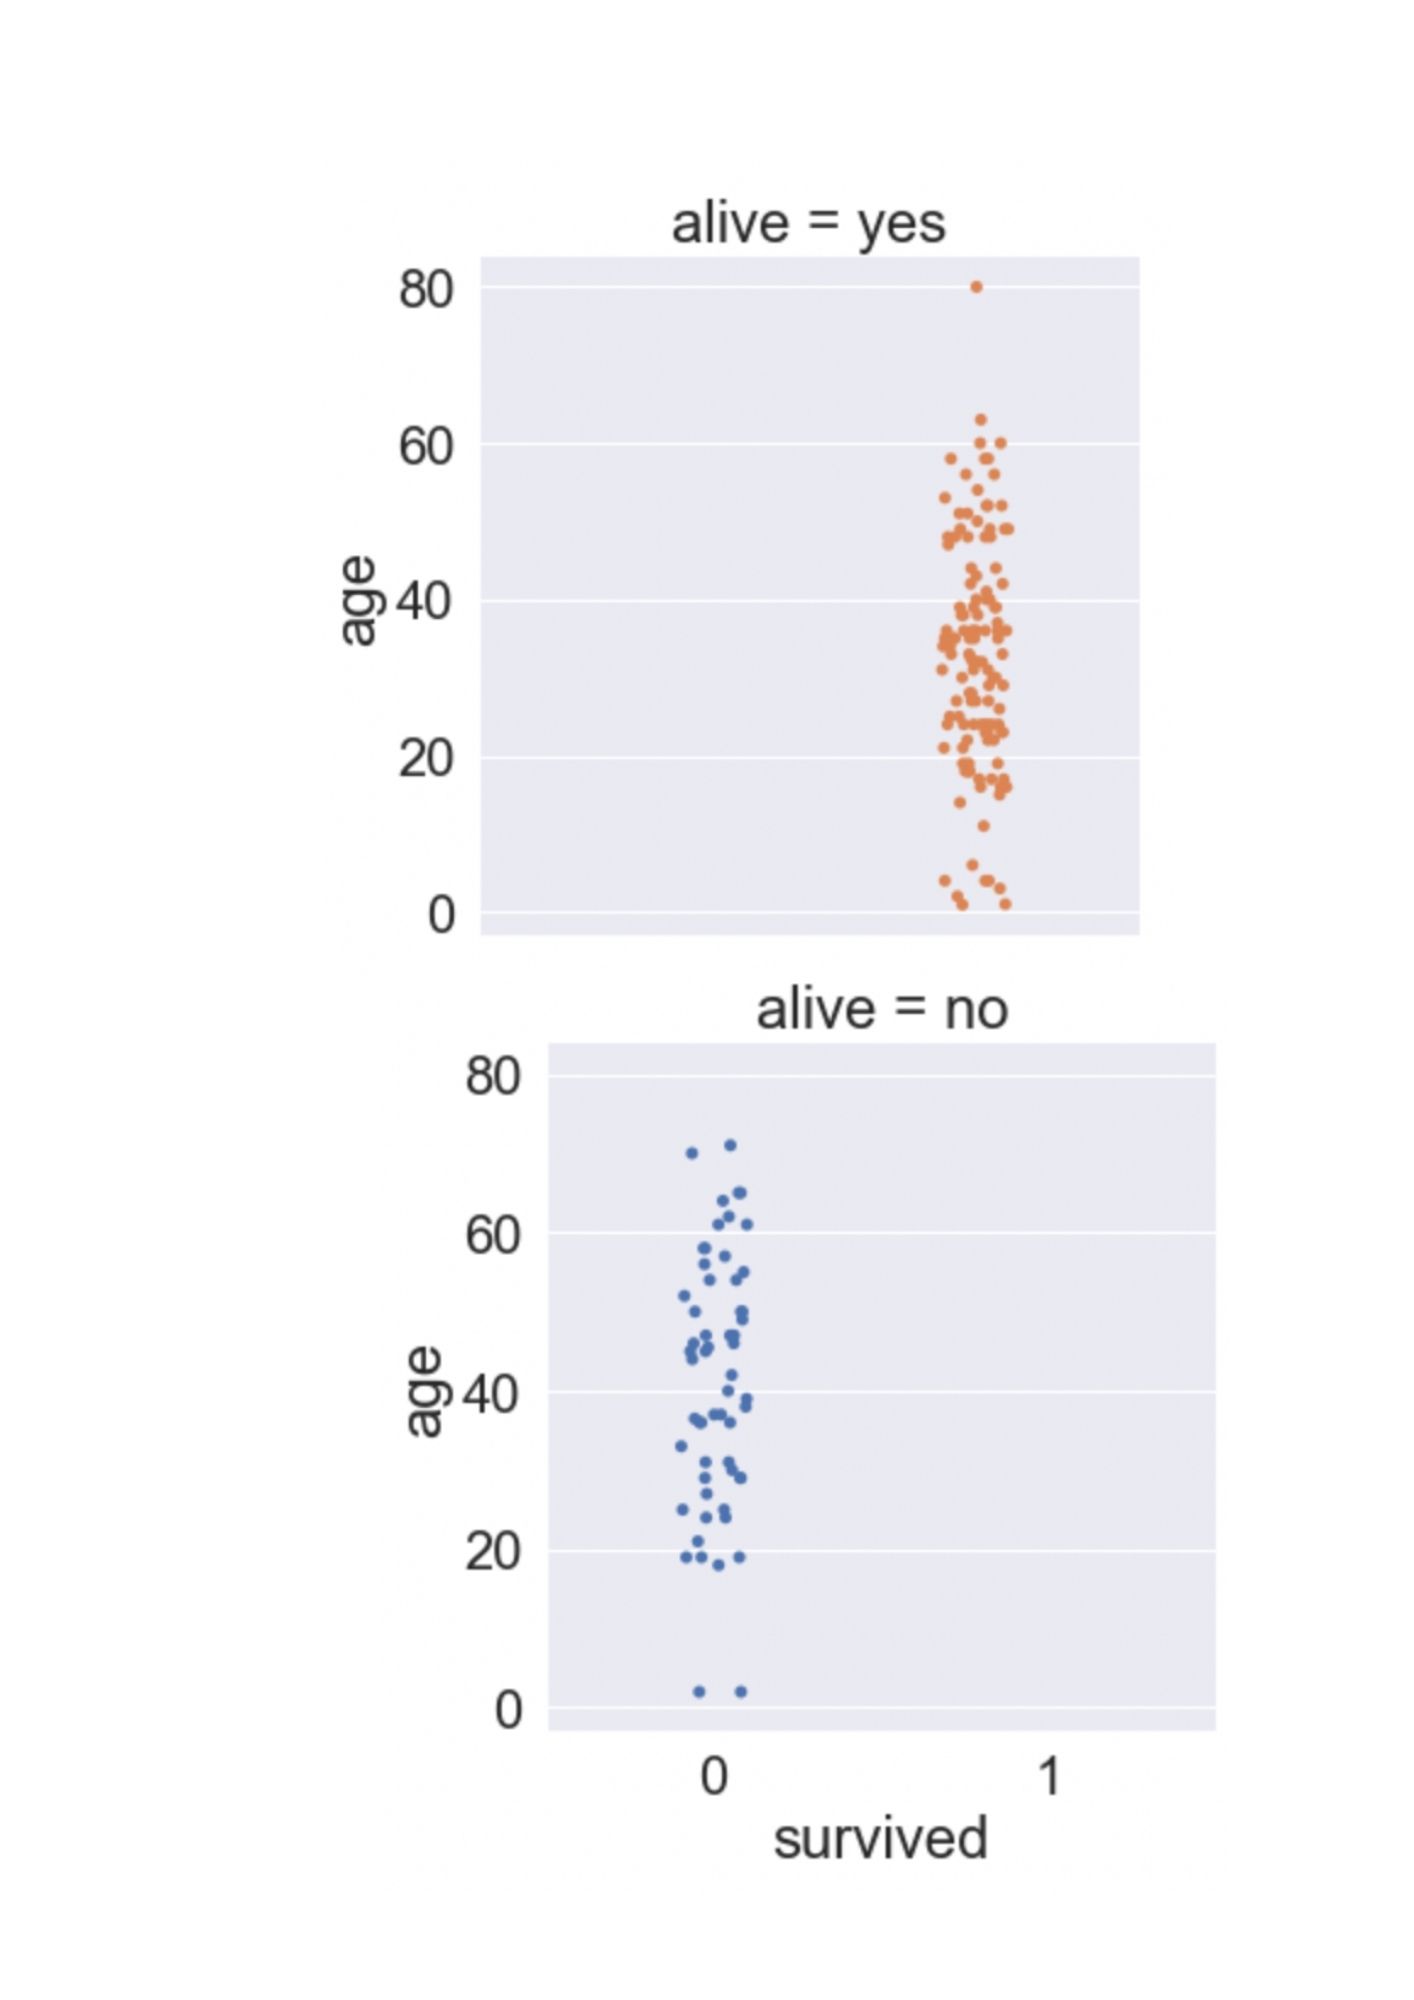
Catplot() with kind set to strip plot
sns.catplot(x='survived', y='age', data=titanic, row='alive', kind='strip')Output
- Log in to post comments