lmplot is known as a linear model plot. It is a type of line plot.
lmplot is the combination of regplot and FacetGrid. It is intended as a convenient interface to fit regression models across conditional subsets of a dataset.
When thinking about how to assign variables to different facets, a general rule is that it makes sense to use hue for the most important comparison, followed by col and row. However, always think about your particular dataset and the goals of the visualization you are creating.
The parameters to this function span most of the options in FacetGrid, although there may be occasional cases where you will want to use that class and regplot() directly.
Syntax
seaborn.lmplot(x, y, data, hue=None, col=None, row=None, palette=None, col_wrap=None,
height=5, aspect=1, markers=’o’, sharex=True, sharey=True, hue_order=None, col_order=None,
row_order=None, legend=True, legend_out=True, x_estimator=None, x_bins=None, x_ci=’ci’,
scatter=True, fit_reg=True, ci=95, n_boot=1000, units=None, seed=None, order=1, logistic=False,
 lowest=False, robust=False, logx=False, x_partial=None, y_partial=None, truncate=True, x_jitter=None,
y_jitter=None, scatter_kws=None, line_kws=None, size=None)
Example
import pandas as pd
import matplotlib.pyplot as plt
import seaborn as sns

data= sns.load_dataset('penguins')
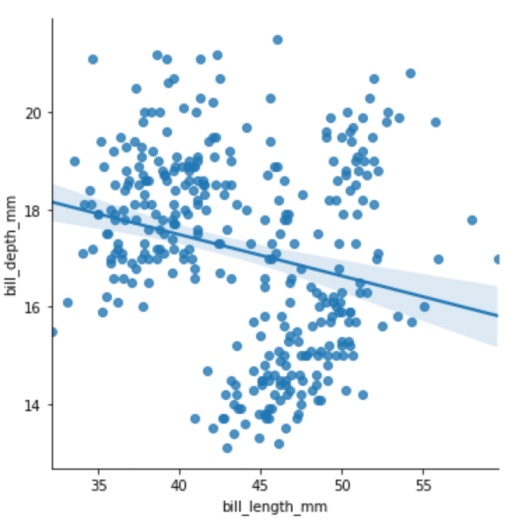
sns.lmplot(x='bill_length_mm', y='bill_depth_mm', data=data)Output
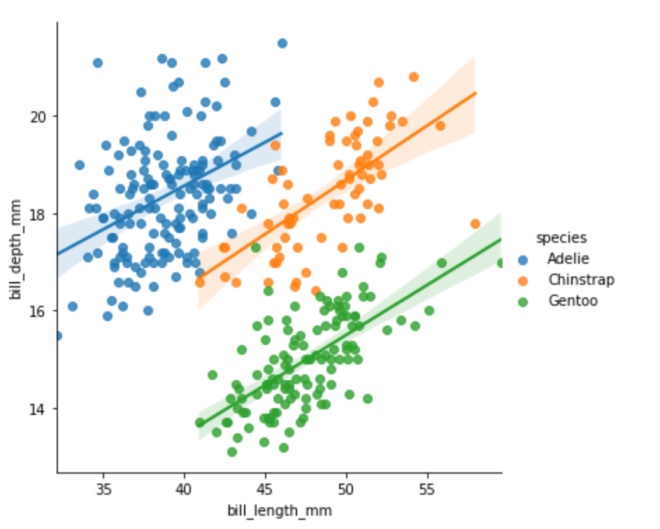
sns.lmplot(x='bill_length_mm', y='bill_depth_mm',hue='species',data=data)Output
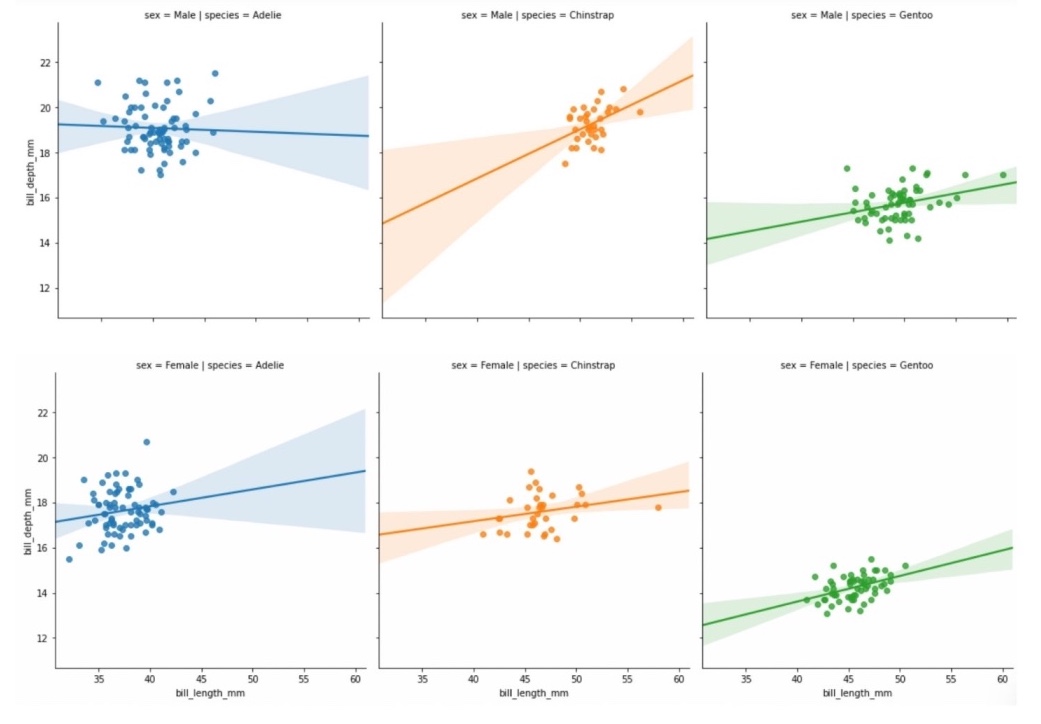
sns.lmplot(x='bill_length_mm', y='bill_depth_mm', hue='species',col='species',row='sex',truncate=False,data=data)Output:
- Log in to post comments