FacetGrid is basically used to plot two or more than two categorical features against two or more than two numeric features. It also helps in visualizing the distribution of one variable and also the relationship between multiple variables within the subset of the given dataset using multiple panels.
It maps the datasets into multiple axes arrayed which is a grid of rows and columns that returns different levels of variables in the datasets. The plots which are produced are called “lattice”, “trellis”, or “small-multiple” graphics.
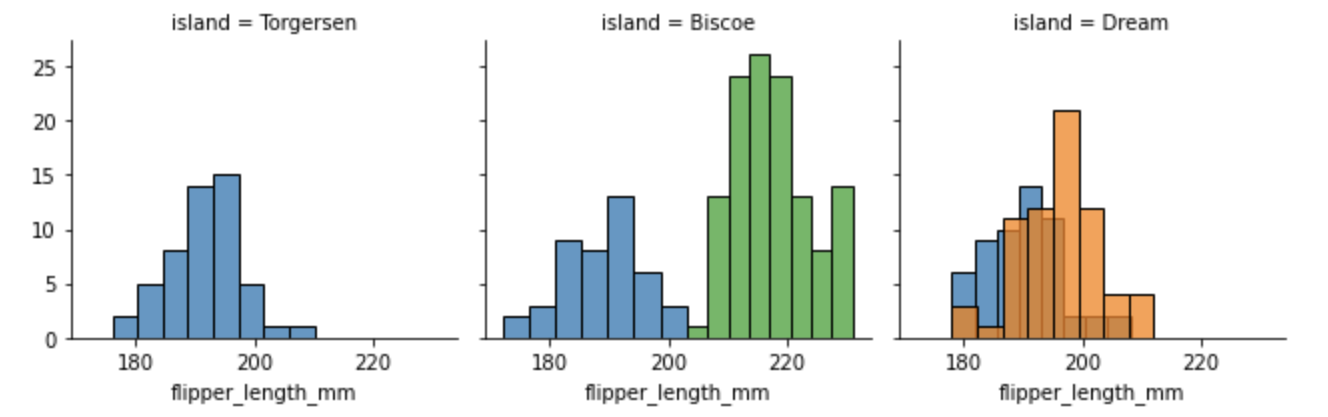
Here we can also use hue parameters that plot different subsets of data with different colors.
Syntax
seaborn.FacetGrid(**kwargs)FacetGrid has many arguments that can be used for inputs some of them are described below:
- data: It is a type of long-form of dataframe whose each column is a variable and each row is an observation.
- hue: It is a variable in data that is used to map plot aspects with different colors.
- palette: It takes colors as an input to use for the different levels of the
huevariable. - despin: It is a boolean value that is used to remove the top and right spines from the plots.
- margin_titles: It is a boolean value.If
True, the titles for the row variable are drawn to the right of the last column.
Example
import pandas as pd
import numpy as np
import matplotlib.pyplot as plt
import seaborn as sns

penguins=sns.load_dataset('penguins')
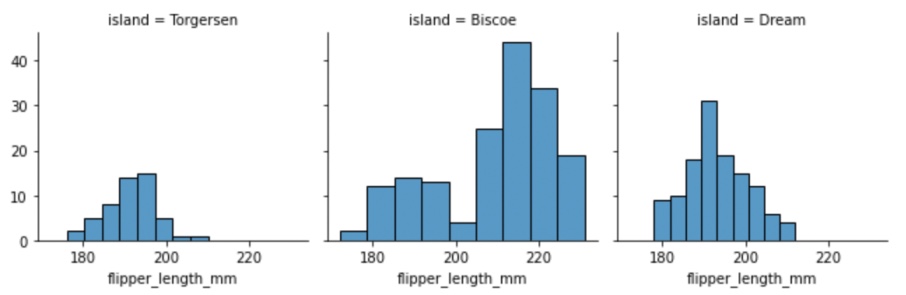
To draw facet grid, the FacetGrid() function is used. The first parameter to the function is the dataset, the second parameter col specifies the feature to plot on columns while the row parameter specifies the feature on the rows. The FacetGrid() function returns an object.
g = sns.FacetGrid(penguins, col='island')
g.map(sns.histplot, "flipper_length_mm")
Output:
g = sns.FacetGrid(penguins, col='island',hue='species')
g.map(sns.histplot,"flipper_length_mm")
Output:
- Log in to post comments