Violin plots are similar to box plots and histograms in that they also show us the probability density of the data at different values. As compared to the box plot it only shows a summary of the statistics such as the mean/median and interquartile ranges but the violin plot shows the full distribution of the data.
Violin Plot also includes a maker for the median of the data and also a box indicating the interquartile range, as in box plots.
Sometimes these violin plots can be used to represent the comparison of a variable distribution across different categories.
Violin plots use Kernel density estimation (KDE) to compute an empirical distribution of the sample. This computation is controlled by several parameters.
Violin plots are more informative as it shows the full distribution of the data.
Syntax
matplotlib.pyplot.violinplot(dataset, positions=None, vert=True,
widths=0.5, showmeans=False, showextrema=True, showmedians=False,  quantiles=None,
points=100, bw_method=None, *, data=None)
Parameters:
- datasets: This is input data that can be an array or sequence of vectors.
- positions: It is an array-like structure that is used to set the position of violins. The ticks and limits are automatically set to match the positions.
- vert: If True creates the vertical violin plots else horizontal violin plots.
- widths: It is a scalar or vector value that is used to set the maximal width of each violin. By default, it is 0.5.
- showextrema: This is a boolean value. If True it will toggle rendering of the extrema.
- showmedians: This is a boolean value. If True it will toggle the rendering of the medians.
- quantiles: If the value of the parameter is not None, then set a list of floats in the interval [0, 1] for each violin, which then stands for the quantiles that will be rendered for that violin.
- points: It is a scalar value which is by default 100. It is used to define the number of points to evaluate each of the Gaussian kernel density estimations.
- bw_method: It is used to calculate estimator bandwidth. The rule by default followed is ‘silverman’, ‘scott’, a callable or a scalar constant.
Returns:
It returns a dictionary that has the mapping of each and every component of the violin plot to a list of the respective collection instances.
The dictionary contains the following keys:
- bodies: A list that has PolyCollection instances that contain the filled area of each violin.
- cmeans: A LineCollection instance is created to mark the mean of each violin's distribution.
- cmins: A LineCollection instance is created to mark the bottom of each violin's distribution.
- cmaxes: A LineCollection instance is created to mark the top of each violin's distribution.
- cbars: A LineCollection instance is created to mark the centre of each violin's distribution.
- cmedians: A LineCollection instance that is used to mark the median value of each of the violin's distribution.
Examples
import matplotlib.pyplot as plt
import numpy as np
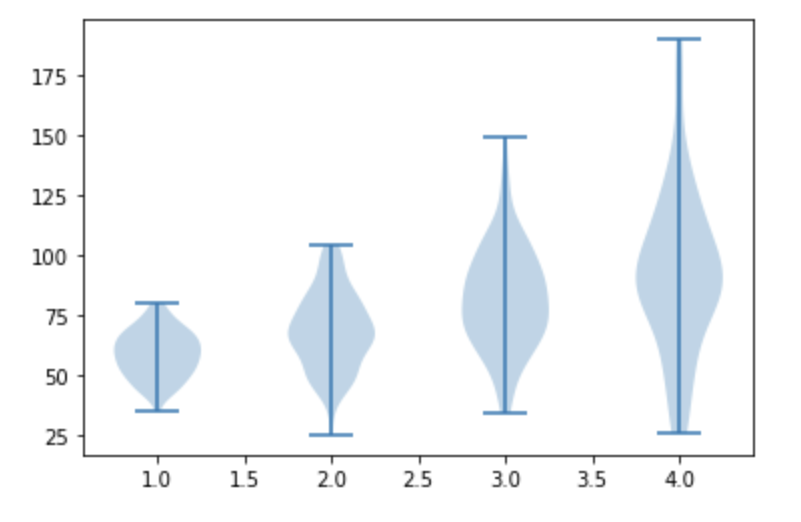
np.random.seed(100)
data_0=np.random.normal(60, 10, 100)
data_1=np.random.normal(70, 15, 100)
data_2=np.random.normal(80, 20, 100)
data_3=np.random.normal(90, 30, 100)
#combine the given data into a list
x= [data_0,data_1,data_2,data_3]
plt.violinplot(x)
plt.show()Output:
- Log in to post comments