subplot() function is basically act as utility wrapper which is used to create multiple plot in one figure. Utility Wrapper can help in creating a common layouts of subplots and it also includes the enclosing figure object, in a single call.
Syntax
plt.subplots(nrows=1, ncols=1, *, sharex=False, sharey=False, squeeze=True, subplot_kw=None, gridspec_kw=None, **fig_kw)Parameters:
- rows, ncols: Number of rows and columns
- sharex, sharey: It controls sharing properties between x and y axes.
- squeeze: It is used to squeeze out extra dimension form the returned array of axes.
- subplot_kw: It is used to pass the dict with keywords which is used to create subplots.
- gridspec_kw: It is used to pass the dict with keywords which is used as constructor to create a grid on which the subplots are placed.
- **fig_kw: It has all additional keyword arguments are passed.
Example
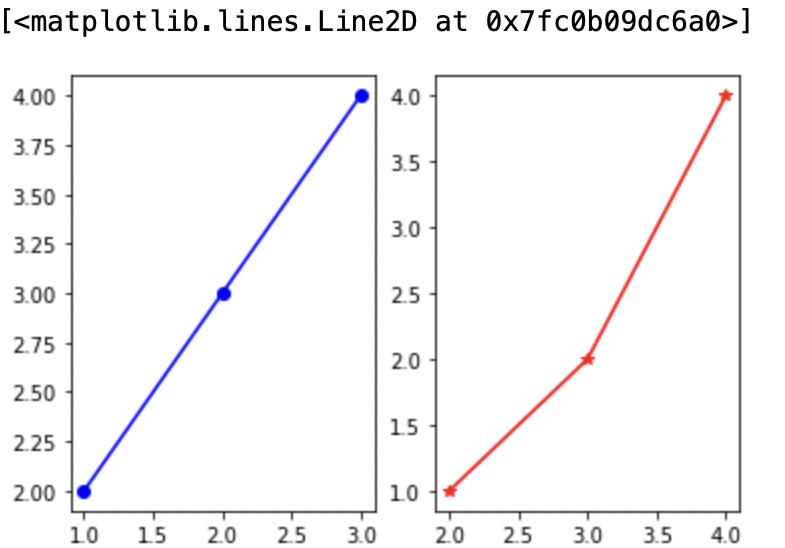
import matplotlib.pyplot as plt
import numpy as np

a=np.array([1,2,3])
b=np.array([2,3,4])
c= np.array([1,2,4])

plt.figure() # used to create figure

#for first subplot
plt.subplot(1,2,1)
plt.plot(a,b, color="blue", marker="o")

# for second subplot
plt.subplot(1,2,2)
plt.plot(b,c, color="red", marker="*")
Output
- Log in to post comments