Matplotlib is a library in python that helps us to visualise the data graphically. pyplot is a module of Matplotlib which provides MATLAB-like interface. To begin with plotting the graph
Firstly we need to import required libraries.
import matplotlib.pyplot as plt
import numpy as np
Then we will define two parameter as an array which is containing points of x and y axis.
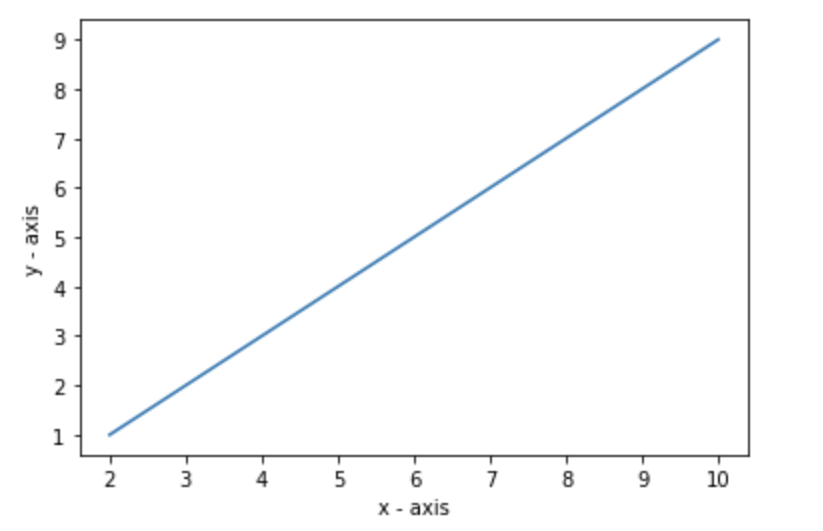
x=np.array([2,4,6,8,10])
y=np.array([1,3,5,7,9])
The plot() function is used to plot the points in a diagram, and then draw line from point to point.
# plotting the points
plt.plot(x, y)
Give the label to x-axis and y-axis using .xlabel() and .ylabel() functions. You can also give title to your graph using title() functions.
# naming the x axis
plt.xlabel('x - axis')
# naming the y axis
plt.ylabel('y - axis')
Finally use show() function to view the graph.
plt.show()Output:
- Log in to post comments