Line Plot can be created in python using Matplotlib's pyplot library. Line plot is used to represent the relation between two data on different axis. It can be used in the same way as bar plot. We can also have multiple lines in a line chart, change color, change type of line and much more.
Import the required libraries
import matplotlib.pyplot as plt
import numpy as np
Create data for plotting the points.
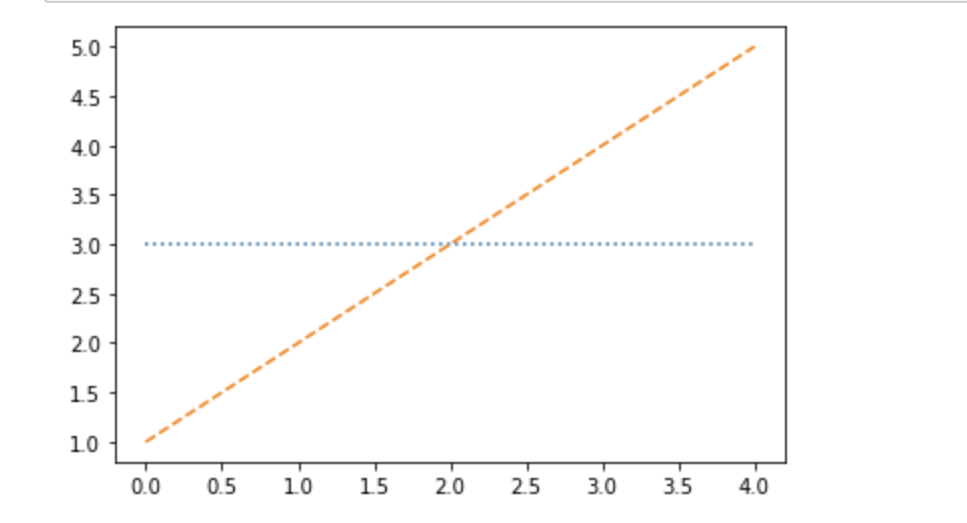
x=np.array([3,3,3,3,3])
y=np.array([1,2,3,4,5])
plt.plot(x,label='x-axis', linestyle = 'dotted')
plt.plot(y,label='y-axis',linestyle = 'dashed')
plt.show()
Output:
- Log in to post comments