In matplotlib quiver plot is also a type plot which is a basic 2D plot which has vector lines as arrows. These types of plots are gerenally used in Electrical Engineers to visualize electrical potential and show stress gradients in Mechanical engineering. It display the velocity vector as arrows with the components (u, v) at the point (x, y).
Creating a Quiver Plot
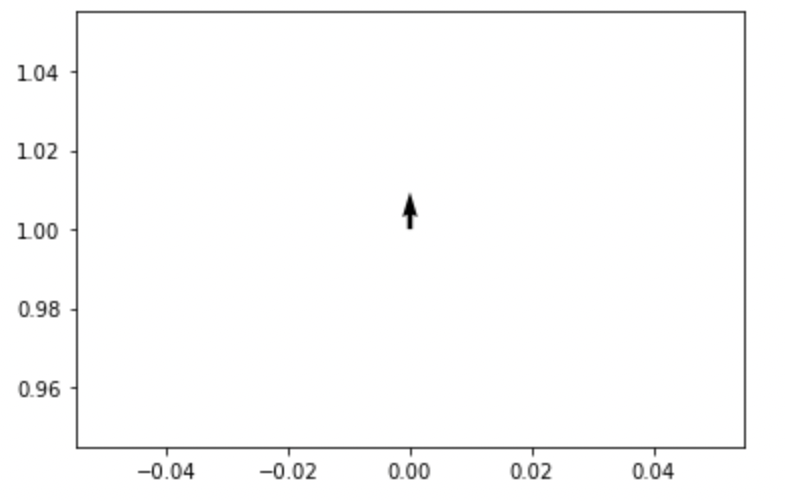
Here we are going to plot a simple and easy quiver plot using only one arrow by using ax.quiver().
Syntax
ax.quiver(x_pos, y_pos, x_dir, y_dir, color) Parameters:
x_pos and y_pos are the position of the arrow and x_dir and y_dir the direction of the arrow while color is the color of arrow.
Examples
import matplotlib.pyplot as plt
fig, ax = plt.subplots()
x_pos = 0
y_pos = 1
x_direct = 0
y_direct = 1
ax.quiver(x_pos,y_pos,x_direct,y_direct)
plt.show()
Output:
Using 2 Arrows
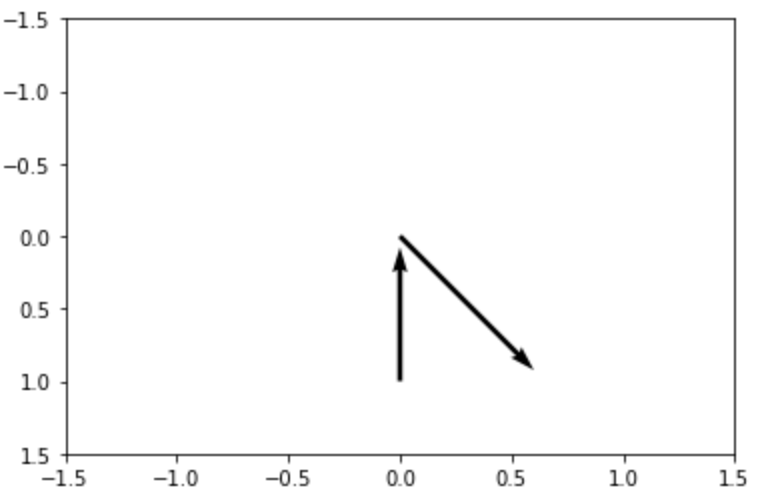
Now we are going to add another arrow in the plot passing through two starting point and in two direction. The original arrow position is (0,0) and direction is (1,0) and secon arrow is at position (0,1) whose direction is (-1,1).
Here, scale= 5 to set the arrow lengths. So make it longer and easier to be visible on plot.
Examples
import matplotlib.pyplot as plt
fig, ax = plt.subplots()
x_pos = [0,0]
y_pos = [0,1]
x_direct = [1,0]
y_direct = [-1,1]
ax.quiver(x_pos,y_pos,x_direct,y_direct, scale=5)
ax.axis([-1.5,1.5,1.5,-1.5])
plt.show()
Output:
- Log in to post comments