Box Plot is also known as Whisker Plot. It is use to display the summary of the set of data values which contain the minimum, first quartile to the third quartile and maximum.
In box plot we draw first box from the first quartile to the third quartile. A vertical ine goes through the box at the median. It is also useful in comparing the distribution of data sets by drawing boxplots of each of them.
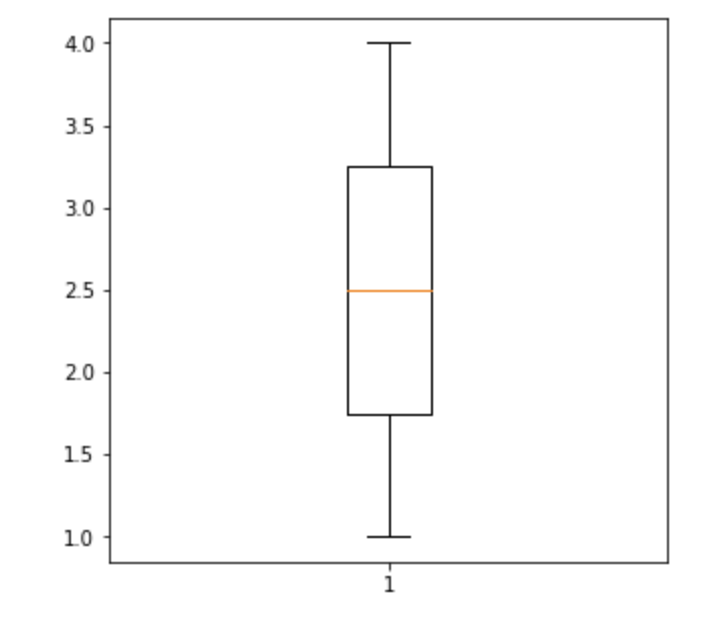
Create a box plot
In Matplotlib Package there is a pyplot module in which there is a boxplot() function which can be used to create a box plot.
matplotlib.pyplot.boxplot(x, notch=None, sym=None, vert=None, whis=None,
positions=None, widths=None, patch_artist=None, bootstrap=None,
usermedians=None, conf_intervals=None, meanline=None, showmeans=None,
showcaps=None, showbox=None, showfliers=None, boxprops=None, labels=None,
flierprops=None, medianprops=None, meanprops=None, capprops=None,
whiskerprops=None, manage_ticks=True, autorange=False, zorder=None, *, data=None
Parameters:
- x: The input data which is array or sequence.
- notch: It is used to display notched box plot.
- sym: It is the default symbol for flier points. You can enter an empty string to hide the flier points.
- vert: It is a boolean value. If False then draws a horizontal box and if True vertical box.
- whis: It represent the position of whiskers.
- positions: It is used to set the position of box.
- widths: It is used to set the width of the box.
- patch_artist: It is an optional parameter.
- bootstrap: It is an int which is used specifies whether to bootstrap the confidence intervals around the median for notched boxplots.
- usermedians: It is an array or sequence whose dimension is compatible with data.
- conf_intervals: It is an array or sequence whose first dimension is compatible with data and whose second dimension is 2.
- meanline: It is a boolean value which try to render meanline as full width of box
- manage_tricks: It is a boolean value when True, it allows the tick locations and labels will also be adjusted to match the boxplot positions.
- autorange: If it is True then data should be distributed in such a way that the percentile of 25th and 75th should be equal.
- zorder: It is used to set the order of the box plot.
Examples
import matplotlib.pyplot as plt
import numpy as np
# data to display on plots
x= np.arange(1,5)
# Creating figure object
fig = plt.figure(figsize =(5,5))
plt.boxplot(x)
plt.show()
Output
- Log in to post comments