In Matplotlib we can draw multiple graphs in a single plot using subplot().
pyplpot.subplot() function is a kind of wrapper function that allows us to plot more than one graph in a single plot. It can create a figure and a grid of subplots with a single call which can provide a reasonable control over how individual plots are created.
This function can return a figure and an axes object or also an array of axes objects.
If we use this function without any parameters, then it will return a figure object and one Axes object.
Syntax
subplots(nrows, ncols, sharex, sharey, squeeze, subplot_kw, gridspec_kw, **fig_kw)Parameters:
- nrows, ncols: Its default value is 1. It is used to define numbers of rows and columns of the subplot grid respectively.
- sharex, sharey: It is by default False. These parameters are used to specify the properties that are shared among x and among y axis.
- squeeze: It is used to squeeze out or remove the extra dimension from the array. By default this value is False.
- subplot_kw: By default it is None. It is used to allow us to add keywords to each subplot.
- gridspec_kw: By default it is None. It allows us to add grids on each subplot.
- **fig_kw: By default it is None. It allow us to pass any additional keyword argument to the function call.
Example
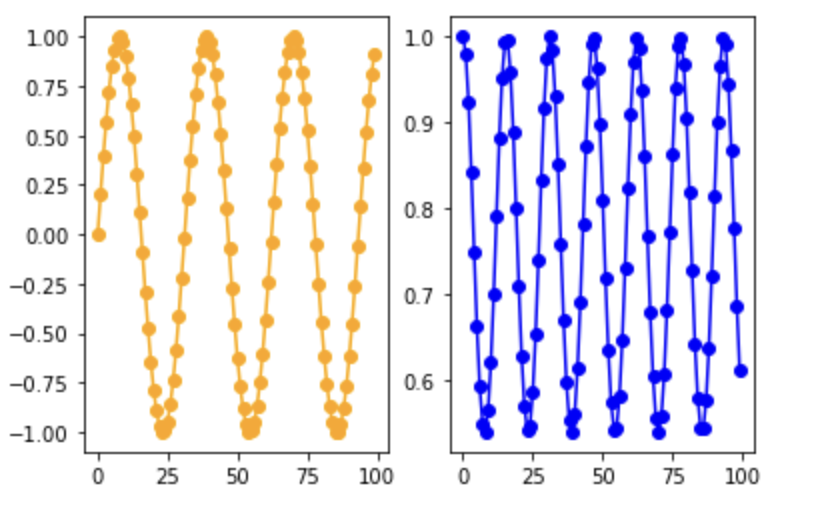
import matplotlib.pyplot as plt
import numpy as np
x = np.linspace(0, 20, 100)
y = np.sin(x)
z=np.cos(y)
plt.figure()
# adding first subplot
plt.subplot(121)
plt.plot(y ,color="orange", marker="o")
# addding second subplot
plt.subplot(122)
plt.plot(z ,color="blue", marker="o")
plt.show()
Output:
- Log in to post comments