This function is used to handle the marker which is used to emphasize each point with the specified marker. It is used in the both marker functionality of the plot and scatter
In the table below there are some possible markers in matplotlib:
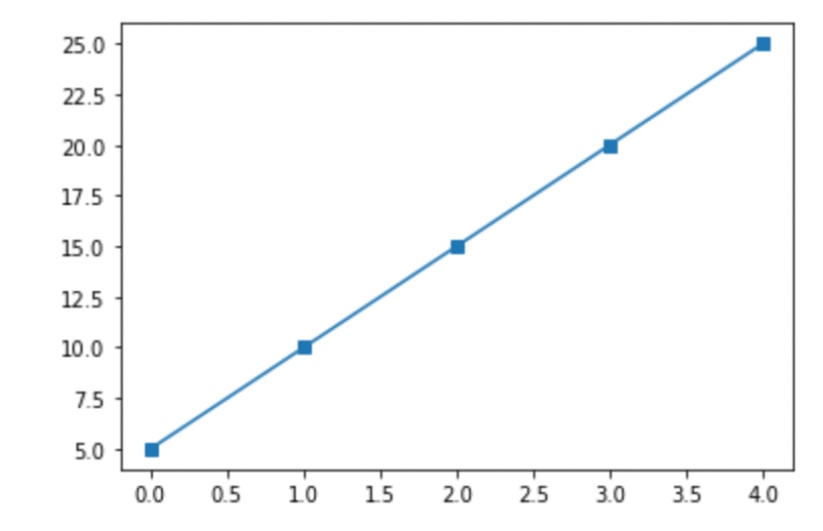
Example
import matplotlib.pyplot as plt
import numpy as np

x = np.array([5,10,15,20,25])

plt.plot(y, marker = 's')
plt.show()
Output
- Log in to post comments