Creating axis Labels for the Plot
We can use xlabel() and ylabel() function to add label to the x and y axis respectively.
Creating Title for the Plot
We can use title() function to give specific title to the plot.
Example
import matplotlib.pyplot as plt
import numpy as np
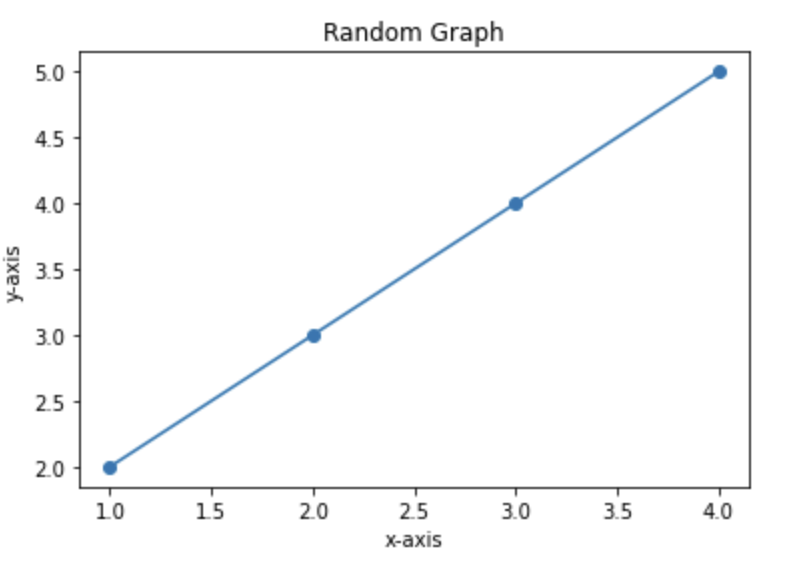
x=np.array([1,2,3,4])
y=np.array([2,3,4,5])
plt.plot(x,y, marker='o')
Here we will use xlabel and ylabel() to add labels to axes.
plt.xlabel('x-axis')
plt.ylabel('y-axis')
Now, we will give title to the plot.
plt.title('Random Graph')
plt.show()Output:
- Log in to post comments