Histogram is a graph which shows frequency distributions. It is another excellent tool which we can use for for visualizing and can also easily understand the probabilistic distribution of numerical data.
A histogram shows the frequency on the vertical axis and the horizontal axis is another dimension. It usually relates to only one value and shows its distribution in different range of the values called as bin. Each bin has a maximum and minimum values. Each bin also has a frequency between x and infinite.
How to create a Histogram?
- The first step is to create a bin of the ranges.
- Now distribute the entire range into series of intervals.
- And then count the values which falls in each interval.
Syntax
plt.hist(x, bins=None, range=None, density=False, weights=None, cumulative=False,
bottom=None, histtype='bar', align='mid', orientation='vertical', rwidth=None,
log=False, color=None, label=None, stacked=False, *, data=None, **kwargs)
Parameters:
- x: It is input array or sequence of arrays.
- bins: It is optional. It contains integer or sequence or strings.
- range: It describe lower and upper range of the bin.
- density: It has a boolean value. It is used to return the probability density if True.
- weights: It has. array of weights having same dimensions.
- cumulative: If the provided value is True the it computes the histrograms where each bin gives the counts in that bin plus all bins for smaller values.
- bottom: It is used for location of bottom of each bins.
- histtype: It is used to describe the type of Histrogram which we want.
- align: It describes the horizontal alignment of Histrogram
- rwidht: It is the relative width of the bins with respect to bin width.
- label: It is string, or sequence of strings to match multiple datasets.
- color: It is color of sequence, one per dataset.
- stacked: If False multiple data are arranged step by step and If True then data are stacked on top of each other.
Example
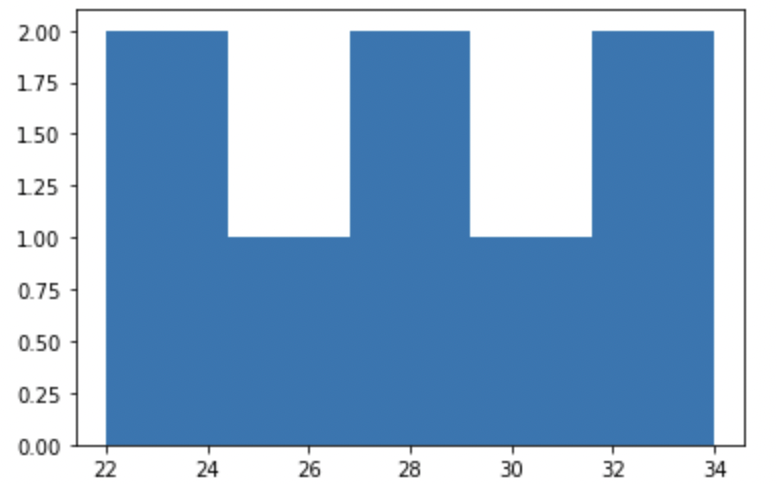
import numpy as np
import matplotlib.pyplot as plt

x = [22,24,26,28,29,31,32,34]
num_bins = 5

bins= plt.hist(x, num_bins)
plt.show()
Output:
- Log in to post comments