Axes is the region of image that has the data space. The Axes in the Matplotlib are of two types 2-axis(in 2D object) and 3-axis(in 3-D object) which is used to take care of the data limits.
In the graph given below there are different parts of figures which are mentioned below:
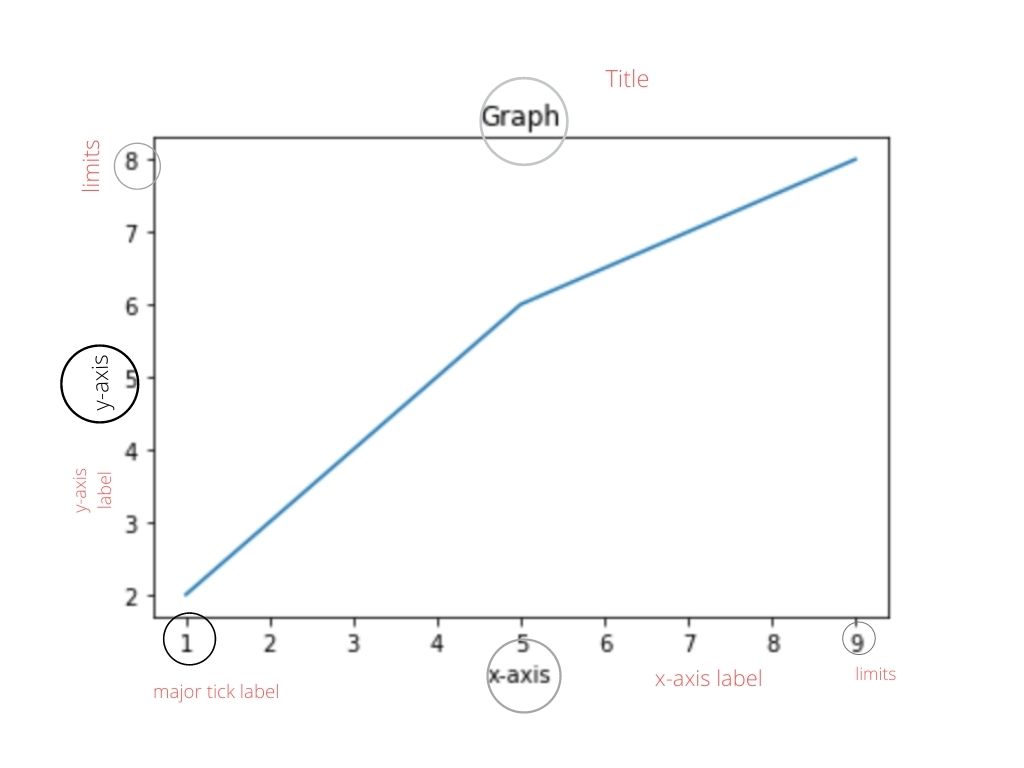
Labelling of x-axis
Axes.set_xlabel(self, xlabel, fontdict=None, labelpad=None, \*\*kwargs)By using above function you can easily label the x-axis.
Labelling of y-axis
Axes.set_ylabel(self, ylabel, fontdict=None, labelpad=None, \*\*kwargs)The above can be used to label the y-axis.
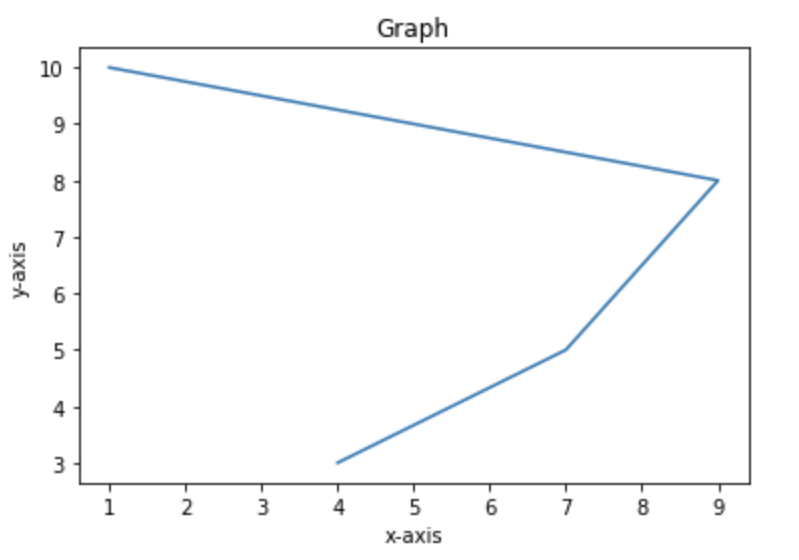
Examples
import matplotlib.pyplot as plt
import numpy as np
f=plt.figure()
x=np.array([1,9,7,4])
y=np.array([10,8,5,3])
# label x-axis and y-axis
plt.xlabel('x-axis')
plt.ylabel('y-axis')
plt.title('Graph')
plt.plot(x,y)
plt.show()
Output
Limits of x-axis
Axes.set_xlim(self, left=None, right=None, emit=True, auto=False, \*, xmin=None, xmax=None)Parameters:
- left: It is used to define the starting point in the data coordinates.
- right: It is used to define the ending point in the data coordinates.
- auto: If True then this will turn on autoscaling of x-axis else false.
- xmin, xmax: It is equivalent to left and right respectively, and it will cause error if we pass both xmin and left or xmax and right.
Limits of y-axis
Axes.set_ylim(self, bottom=None, top=None, emit=True, auto=False, \*, ymin=None, ymax=None)Parameters:
- bottom: It is used to define the starting point in the data coordinates.
- top: It is used to define the ending point in the data coordinates.
- auto: If True then this will turn on autoscaling of y-axis else false.
- ymin, ymax: It is equivalent to bottom and top respectively, and it will cause error if we pass both ymin and left or ymax and right.
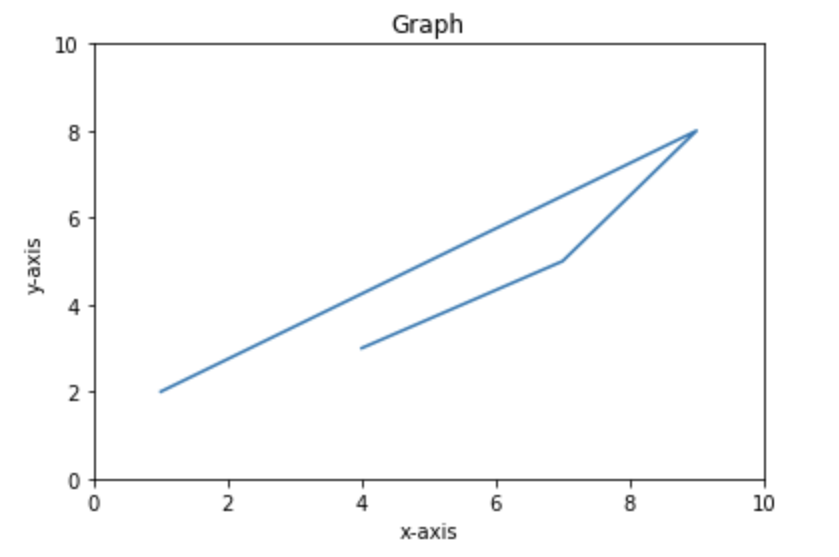
Examples
import matplotlib.pyplot as plt
import numpy as np
f=plt.figure()
fig, ax = plt.subplots()
x=np.array([1,9,7,4])
y=np.array([2,8,5,3])
# label x-axis and y-axis
plt.xlabel('x-axis')
plt.ylabel('y-axis')
plt.title('Graph')
# set x-axis, y-axis limits
ax.set_xlim(0,10)
ax.set_ylim(0,10)
plt.plot(x,y)
plt.show()
Output:
Major and Minor Tick
In Matplotlib the values of x-axis and y-axis are basically ticks.Minor ticks are division of major ticks.
Therefore there are two classes which can be used for controlling the ticks:
You can easily import these two classes from matplotlib:
MultipleLocator(): It is used to place the ticks on multiple of some base.
FormatStrFormatter: It will use aformat string to format the tick labels.
Note: Minor Tick are by default off and we can trun them ON without using labels by just setting the minor locator while minor tick while minor tick labels can be turned ON with the help of minor formatter.
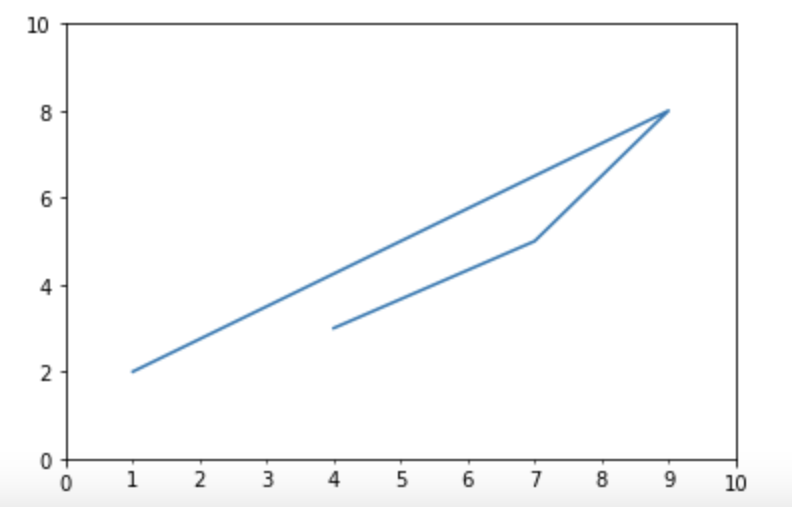
Example
import matplotlib.pyplot as plt
import numpy as np
from matplotlib.ticker import (MultipleLocator,
                               FormatStrFormatter,
                               AutoMinorLocator)
x=np.array([1,9,7,4])
y=np.array([2,8,5,3])
fig, ax = plt.subplots()
ax.set_xlim(0, 10)
ax.set_ylim(0, 10)
# Make x-axis with major ticks that
ax.xaxis.set_major_locator(MultipleLocator(10))
ax.xaxis.set_major_formatter(FormatStrFormatter('%d'))
 # make x-axis with minor ticks that
ax.xaxis.set_minor_locator(MultipleLocator())
ax.xaxis.set_minor_formatter(FormatStrFormatter('%d'))
ax.plot(x, y)
plt.show()
Output:
- Log in to post comments