In Matplotlib Pyplot grid() function is used to add or configure grids line in the plot.
Syntax
matplotlib.pyplot.grid(visible=None, which='major', axis='both', **kwargs)Parameters:
- visible: It is by default None.
- which: It is used to apply the changes on the grid lines.
- axis: It is used to define the axis on which we want to apply the changes.
- **kwargs: It defines the properties of lines
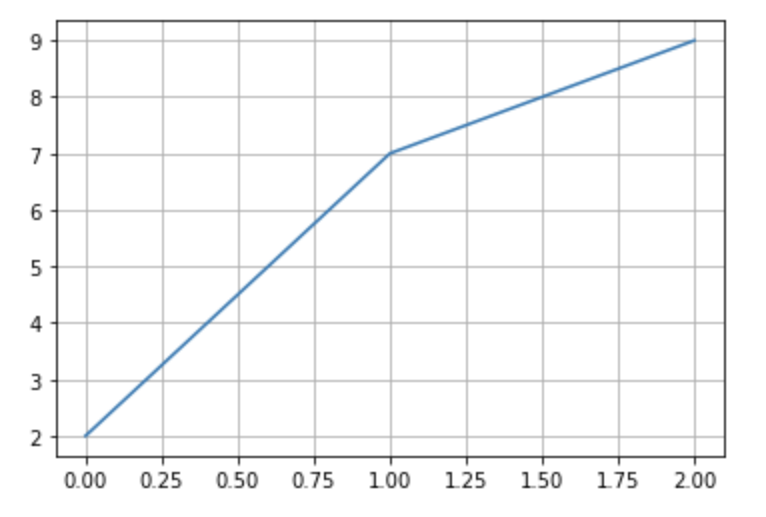
Example
import matplotlib.pyplot as plt
import numpy as np

x = np.array([2,7,9])

plt.plot(x)
plt.grid()
plt.show()
Output
- Log in to post comments