Matplotlib conatins a Figure class in matplotlib.figure module.This class is a top-level conatiner for all the plot elements.
The Figure object can be instantied by just calling the figure() function from pyplot module. It is a state-based interface in Matplotlib Library.
Pyplot can help us in plotting histograms, violin plot, contour plot, 3D plots, and many more.
By using Python Inheritance and extending Figure class we can also create a custom class based on requirements.
To create a figure() function we can use the following syntax and pyplot module in matplotlib package.
class matplotlib.figure.Figure(figsize=None, dpi=None, facecolor=None,
edgecolor=None, linewidth=0.0, frameon=None, subplotpars=None,
tight_layout=None, constrained_layout=None, *, layout=None, **kwargs)
Parameters:
- figsize: It is used to specify the figure dimensions in inches.
- dpi: Dots per inch. It Is used to indicate the resolution of figure.
- facecolor: It is the figure patch facecolor.
- edgecolor: It is the figure patch edge color.
- linewidth: It is the linewidth of the frame.
- frameon: If we don't want the frame of the figure this parameter is used.
- subplotspars: It is the Subplot parameters.
- tight_layout: It is used to adjust subplot parameters.
- constrained_layout: It is used to adjust positioning of plot elements.
Examples
import matplotlib.pyplot as plt
import numpy as np
#creating an array
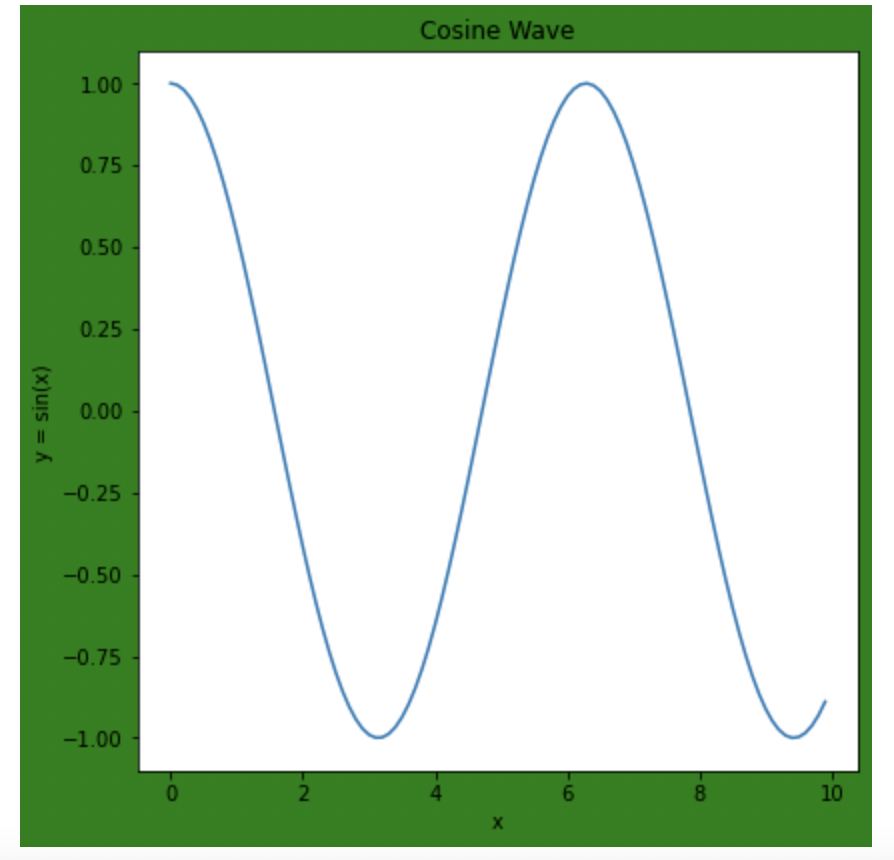
x = np.arange(0,10,0.1)
y = np.cos(x)
#create figure object
fig = plt.figure(figsize = [10, 10], facecolor = 'green')
#create axes object
ax = fig.add_axes([0.5,0.5,0.5,0.5])
#naming the plot
ax.set_title("Cosine Wave")
ax.set_xlabel("x")
ax.set_ylabel("y = cos(x)")
#draw the plot
ax.plot(x, y)
plt.show()Output:
- Log in to post comments