Subtask 2.1: Reduce those Digits!
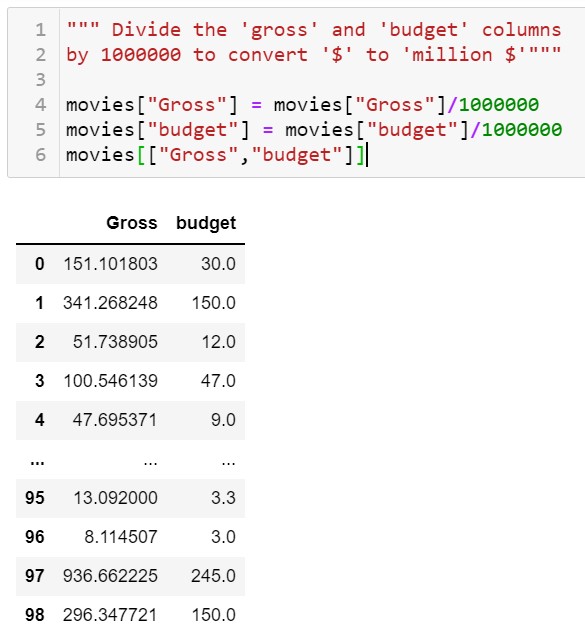
Now, as you can see in the dataset we have two Columns of Gross and Budget. The values that are present under these columns are present in large figures. Therefore, performing the analysis part using this kind of data is a bit complex task. We are going to convert these figures from $ to million $, so as make these columns easily readable.
Follow the given code to follow the same:
movies["Gross"] = movies["Gross"]/1000000
movies["budget"] = movies["budget"]/1000000
movies ["Gross"] and movies["budget"] indicated that we are performing the operation in the movies dataset, where Gross and budget are the column names.
Output
Subtask 2.2: Let's Talk Profit!
It can be noted that the figures are now converted into smaller ones.
Moving ahead in this article, we are going to practice the following four steps:
- We are going to create a new column named profit to calculate and Profit.
- We are going to learn how to sort the column into ascending or descending order.
- We will learn how to call certain top columns for analysis.
- We are going to visualize budget vs Profit using Matplotlib.
- Also, we are going to find all entries with negative profit.
1. Calculating Profit
To calculate the profit we need to know that: Profit= Gross- budget
Also, in the Dataset we have the Gross and Budget column. So, to calculate Profit we find need to subtract the budget Column from the gross column as shown below:
movies["Gross"]-movies["budget"]and then Create a new column to store the profit calculated as below:
movies["profit"]=movies["Gross"]-movies["budget"]Output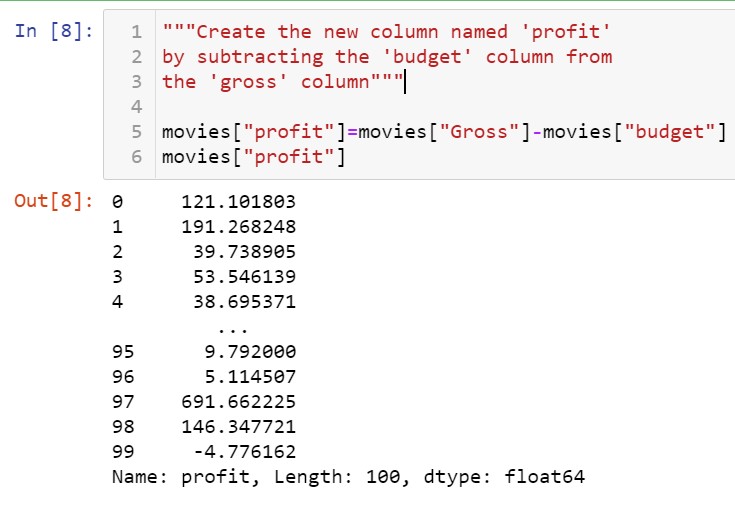
2. Sorting Columns
To sort the values into ascending or descending order sort_values() is used. The method is followed by Column name to decide what column we want to sort. Follow the syntax to sort the data below:
Syntax
Dataset.sort_values(by="Column_name",ascending=False)Now, let's apply the above syntax to sort the data by Profit Column in the dataset:
movies.sort_values(by="profit",ascending=False)NOTE: Data is by default is sorted into ascending order. Therefore, to sort data into descending order we have used ascending= False.
Output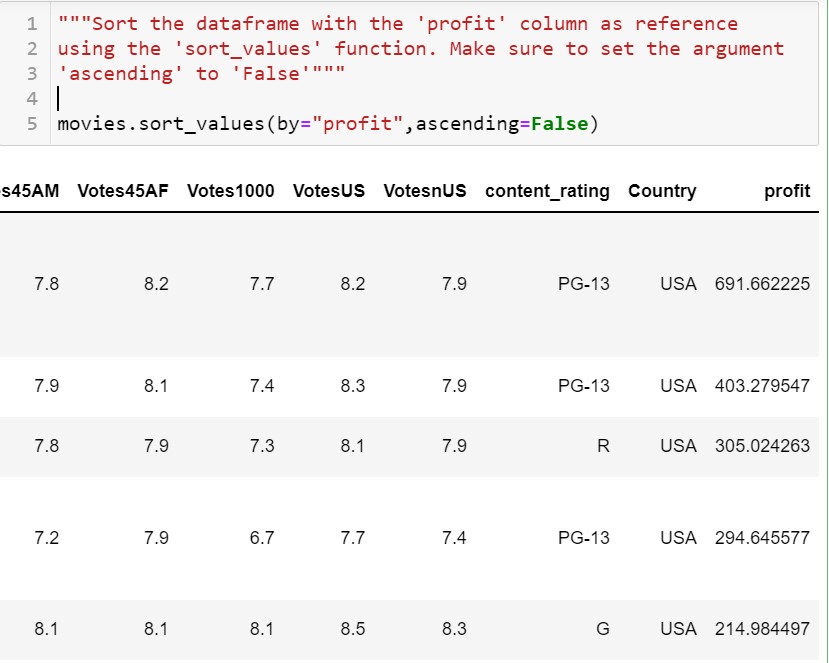
3. Reading top Columns
So to read top n rows in Pandas we use .iloc[1st position: last position] Function. The code to read the top 10 rows with maximum profit is shown below:
movies.sort_values(by="profit",ascending=False).iloc[:10]
NOTE: the last position is never displayed as an output in the .iloc function.
Now, let's Store the top 10 rows in a variable named Top10, follow the code below:
top10=movies.sort_values(by="profit",ascending=False).iloc[:10]
Output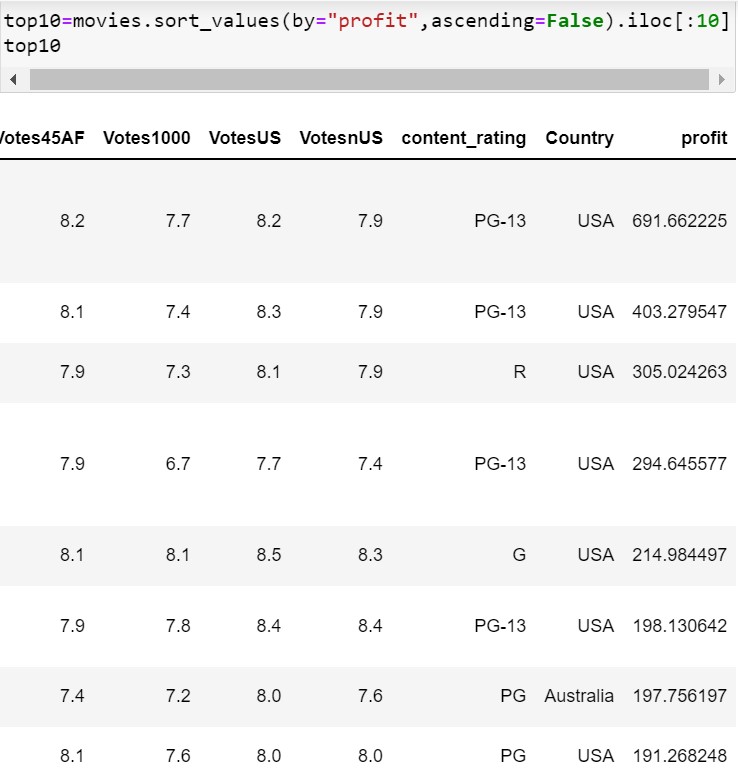
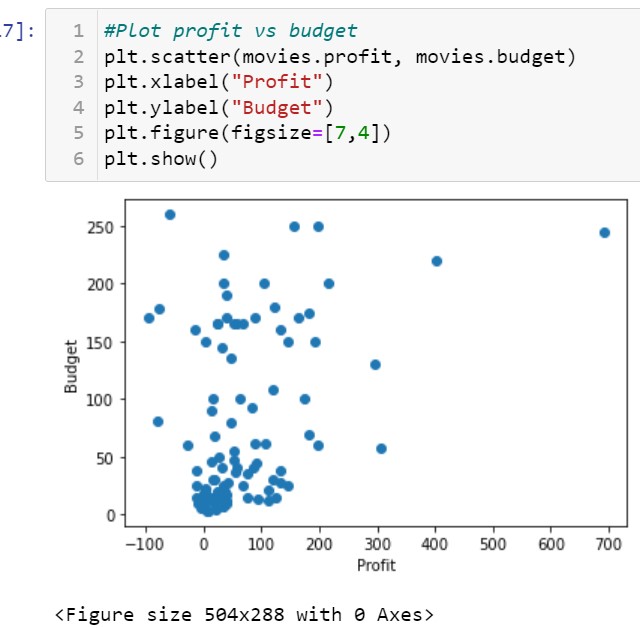
4. Visualizing budget v/s Profit
As we all know, Visualization means presenting data in diagrammatic form to attain some meeting out of it. In python, to do some visualization we need to export the Matplotlib module. Follow the syntax for the same:
Import matplotlib.pyplot as plt
Now that we want to draw a graph with a budget and Profit column we will draw it using a scatter plot. Follow the code to do the same:
plt.scatter(movies.profit, movies.budget)
plt.xlabel("Profit")
plt.ylabel("Budget")
plt.figure(figsize=[7,4])
plt.show()- movies.Profit and movies.budget indicates the columns for movies data frame i.e(Profit and budget).
- xlabel and ylabel are used to give names for the x and y-axis.
- plt.scatter is used to plot a Scatter Plot.
- figsize[x, y] defines the size of the graph with respect to the x and y-axis.
- plt.show() is used to display final graph.
Output
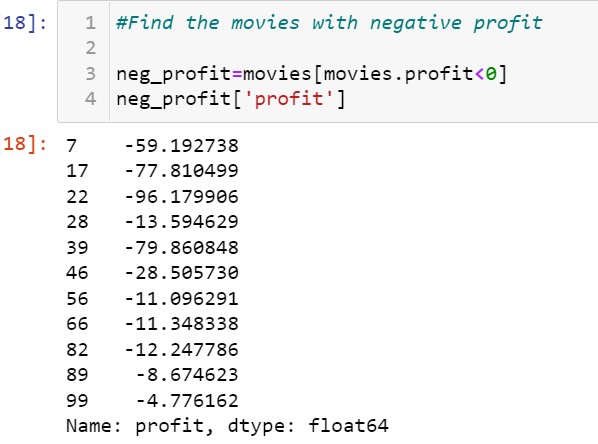
5. Finding negative profit
negative values are those values that are marked less than one. So, to find negative profit we can find those profits whose values are less than 0. Follow the given code for the same:
movies[movies.profit<0]To store the above operation in a variable neg_profit follow the steps:
neg_profit=movies[movies.profit<0]Output
- Log in to post comments