Seaborn is a Data Visualization library that is based on Matplotlib. It is a library present in python which is used for drawing attractive and informative statistical graphics.
In this article, we will see how we can use pandas dataframe for visualization in seaborn.
Step-1: Import the required libraries:
import pandas as pd
import random
import matplotlib.pyplot as plt
import seaborn as sns
Step-2: Creating a Dataset
df = pd.DataFrame()
df['x'] = random.sample(range(1, 100),20)
df['y'] = random.sample(range(1, 100),20)
Step-3: Creating Plots
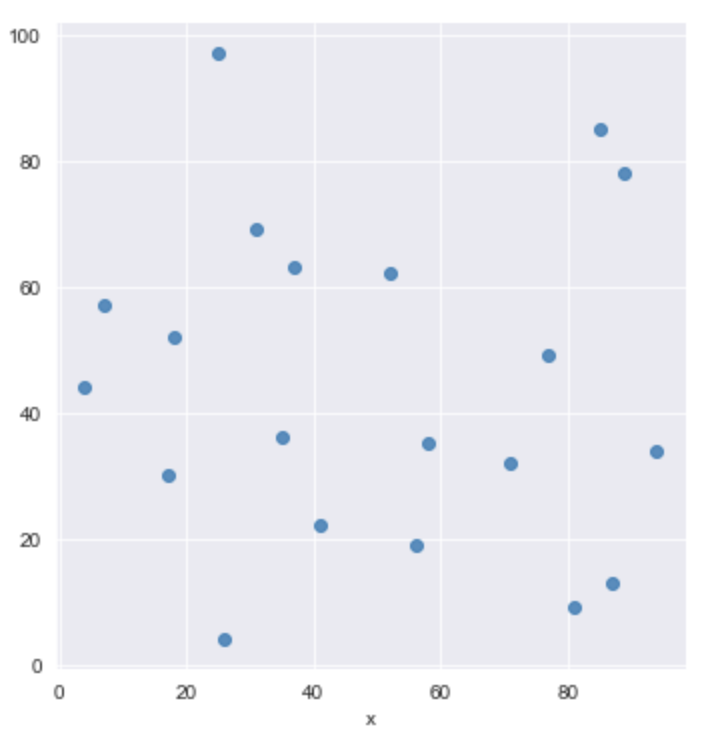
Scatter Plot
sns.lmplot('x', 'y', data=df, fit_reg=False)Output
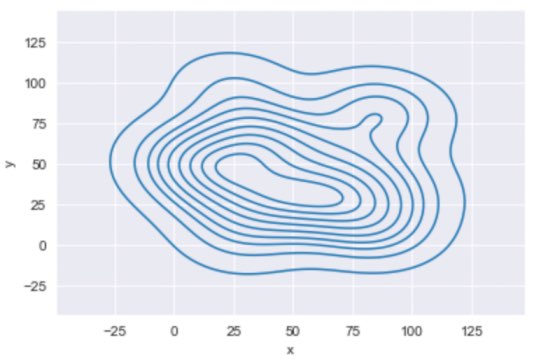
KDE Plot
sns.kdeplot(df.x, df.y)Output
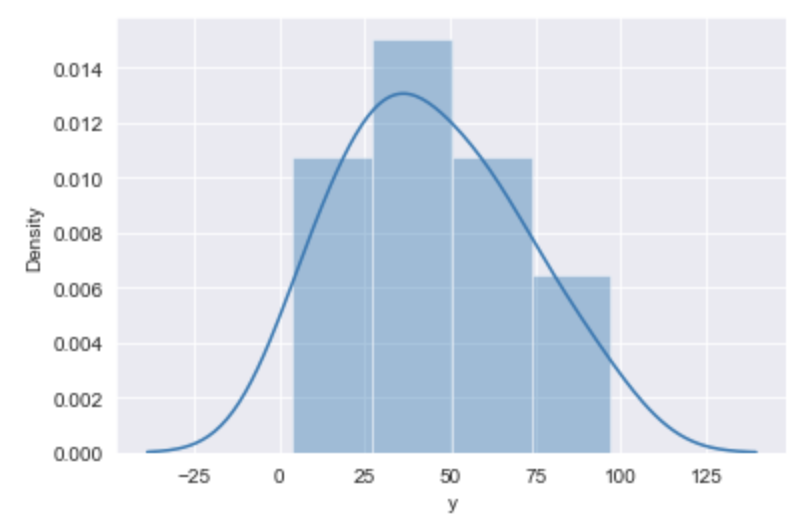
Distplot
sns.distplot(df.y)Output:
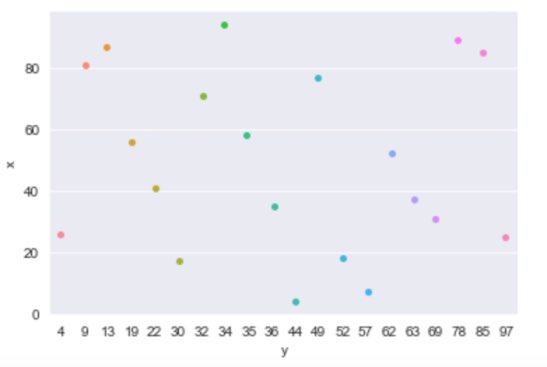
Strip Plot
sns.stripplot(df.y, df.x)Output
- Log in to post comments