In this article, we will be seeing what trace viewer is in the playwright. Trace Viewer is a GUI tool that helps view the executed test along with snapshots, timelines, and other details.
1.) Open the config file and set trace: 'on'
Go to your configuration file and set trace value to either of the following
- off
- on
- on-first-retry
- retain-on-failure
- retry-with-trace
use: {
    trace: 'on-first-retry',
},
2.) Run A Test And Check Trace.
await page.goto("https://www.programsbuzz.com/");
await page.locator('//i[@class="fas fa-search"]').click()
await page.locator('#edit-keys').type('cypress')
await page.locator('#edit-submit').click()
await page.waitForLoadState('networkidle')

const searchTitle = await page.locator('//h1[normalize-space()="Search for cypress"]');

await expect(searchTitle).toHaveText('Search for cypress');

const titles = await page.locator('ol h3').allTextContents()
console.log(titles)

const lastTitle = await page.locator('ol h3').last().textContent()

console.log(lastTitle)

await page.locator('ol h3').last().click()- We are going to run this test and get a trace out of it.
- We can see the trace attached to the report which normally generates.
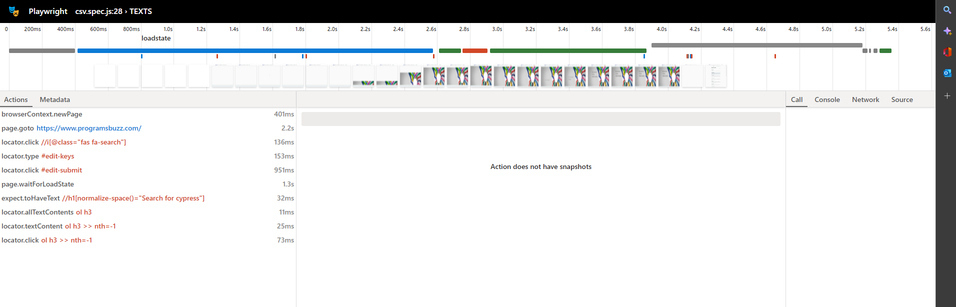
- This is what the trace looks like on the inside.
- We have our actions which are the locators and the actions performed on them.
- We have metadata on which the viewport, browser and other information are present.
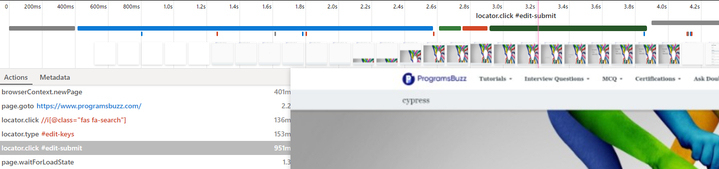
- This is a place where we can view the timeline of the exact actions happening when hovered over certain places we can see the actions getting highlighted.
- It simply means that the actions are being evoked at a certain time and doing their duty.
- We can also download the trace file in zip format from the report and open it via the command-line for later use.
npx playwright show-trace trace.zip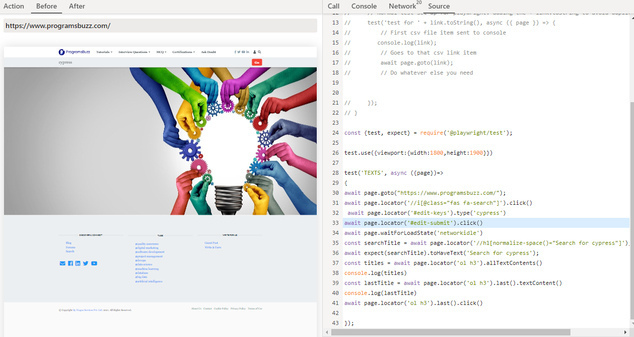
- We can also see the before and after screenshots of the timeline and also view the code-level actions taking place.
- The network tab has the network calls between the operations.
- To see what actions are called call tab is present.
- For console output console tab.
- Log in to post comments