Playwright Inspector is a GUI tool that comes bundled with the playwright framework and is used to record and debug playwright scripts. The playwright team recommends this tool for script troubleshooting.
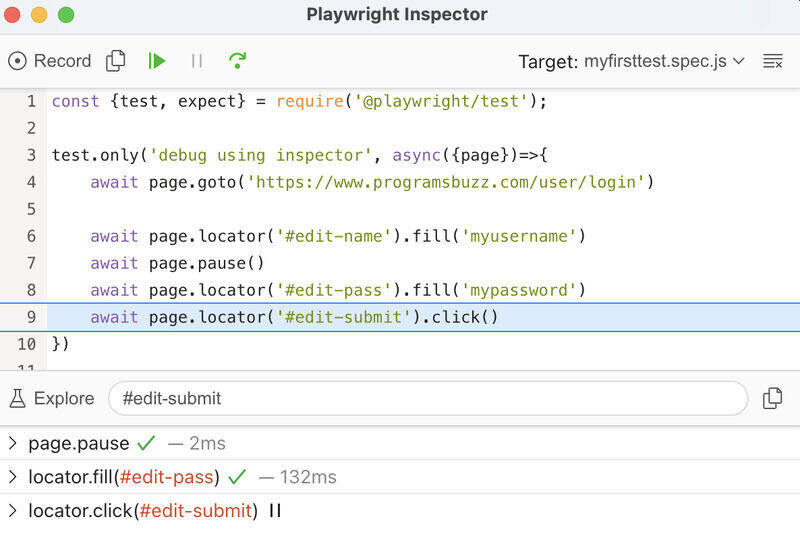
Table of Content
1. Demo Code
For the demo, we have used the Login page of programsbuzz. Here is the code:
test.only('debug using inspector', async({page})=>{
    await page.goto('https://www.programsbuzz.com/user/login')

    await page.locator('#edit-name').fill('myusername')
    await page.locator('#edit-pass').fill('mypassword')
    await page.locator('#edit-submit').click()
})
2. Launch Playwright Inspector
There is no additional configuration required to use this tool. You can open the inspector using three ways:
Using --debug parameter
Add --debug in your command.
npx playwright test --headed myfirsttest.spec.js --project=chromium --debugUsing page.pause()
Add the below command just before the line you want to start debugging.
await page.pause()For example:
test.only('debug using inspector', async({page})=>{
    await page.goto('https://www.programsbuzz.com/user/login')

    await page.locator('#edit-name').fill('myusername')
    await page.pause()
    await page.locator('#edit-pass').fill('mypassword')
    await page.locator('#edit-submit').click()
})
Debugging will start after visiting URL and entering the username value.
Using PWDEBUG Environment Variable
Use command depending on your operating system.
Bash / Mac / Linux
For Bash or Mac, or Linux, use the below command.
PWDEBUG=1 npm run testWindows CMD (Command Line)
For Windows CMD or Command Line, use the below command.
set PWDEBUG=1
npm run test
Windows Power Shell
$env:PWDEBUG=1
npm run test
For Windows Power Shell, Use the below command.
3. Debug using Playwright Inspector
There are three buttons you can use for debugging:
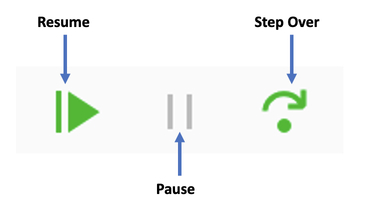
- Step Over Button: To execute the test line by line, we can click the Step Over button. This button will only execute the current test step and stop.
- Resume and Pause Buttons: If you don’t want to go through the test line by line, in that case, you can use the Resume and Pause functionalities. Clicking the resume button will start the test case execution until the pause button is clicked.
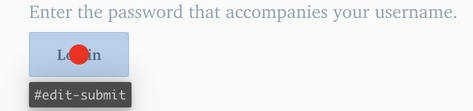
Elements will be highlighted with a red dot or blue color during Step Over.
4. View Debug Logs
In logs, you can see executed steps have green tick marks, and the step that is not executed or we are about to execute are in a pause state.
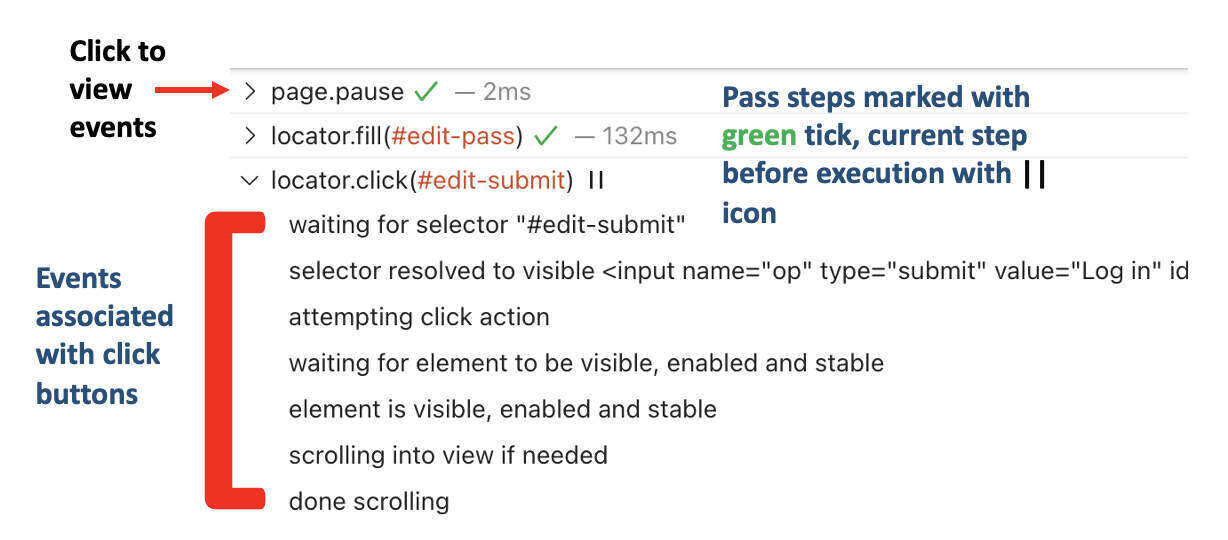
Also, after clicking on the arrow icon for current steps in logs, you can view events associated with the step. In the above screenshot, you can observe events associated with a click button.
- Log in to post comments