Matplotlib Package was initially designed for only two-dimensional plotting, but later when the release of 1.0 happened some 3-D plotting utilities were developed on top of Matplotlib's two-dimensional display in the latest versions and the result is a convenient set of tools for 3-D data visualization.
3-D plots are enabled by importing the mplot3d toolkit which is included with the Matplotlib package.
3-D graphs give us a more dynamic approach and make data more interactive.
Like in 2-D graphs we used different methods to represent graphs same we can do in 3-D graphs. Example: scatter plot, contour plot, surface plot, etc.
In order to create a 3-D plot, we are required to import the mplot3d toolkit.
import numpy as np
from mpl_toolkits import mplot3d
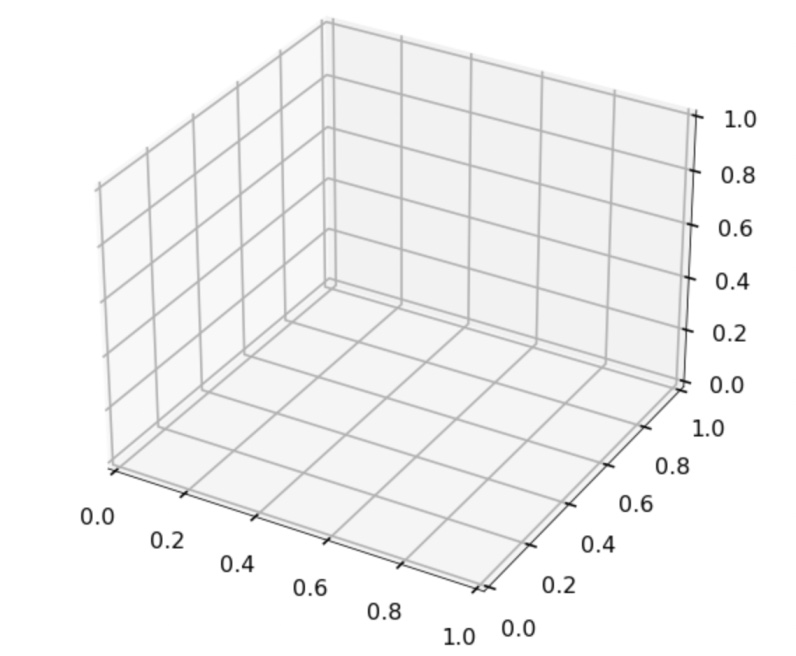
import matplotlib.pyplot as pltOnce the libraries are imported we can create simple 3-D axes that can be easily created by passing the keyword projection='3d'.
fig = plt.figure()
ax = plt.axes(projection='3d')
plt.show()
Output:
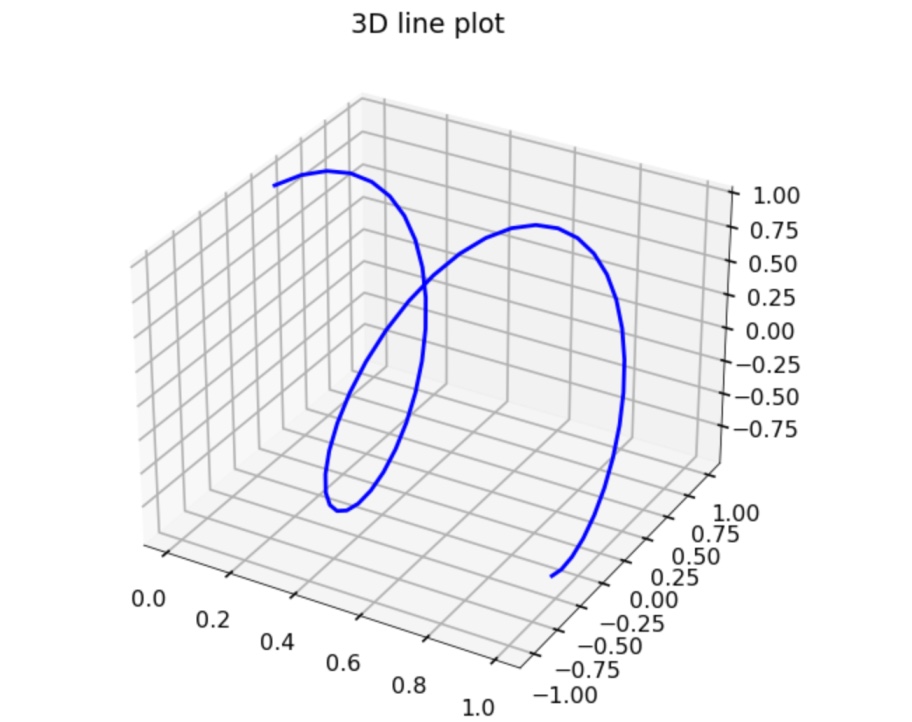
Now, we are going to plot the most basic 3-D plot that is a 3-D line plot that can be easily created by using sets of (x,y,z) triples.
Here we are using ax.plot3D() function to create a 3-D line plot.
Example
from mpl_toolkits import mplot3d
import numpy as np
import matplotlib.pyplot as plt

fig = plt.figure()
ax = plt.axes(projection='3d')
a= np.linspace(0,1,50)
b=np.sin(10*a)
c=np.cos(10*a)

ax.plot3D(a,b,c,'blue')
ax.set_title('3D line plot')
plt.show()
Output
- Log in to post comments