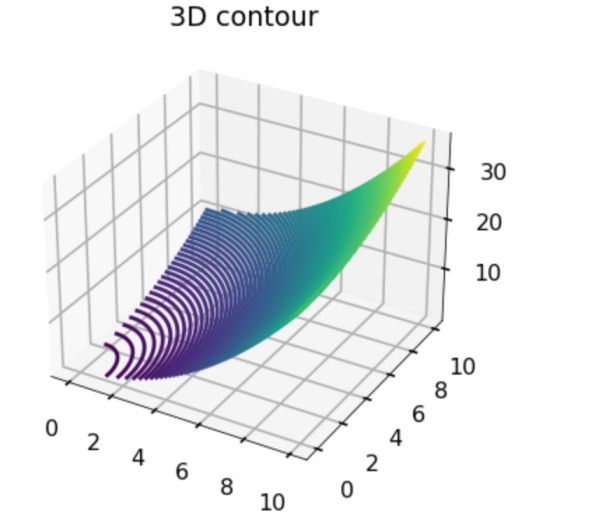
There is a function ax.contour3D() that can be used to create a 3-D function. It takes input data in the form of two-dimensional regular grids, with its Z-data evaluated at each point.
Example
from mpl_toolkits import mplot3d
import numpy as np
import matplotlib.pyplot as plt

a= np.linspace(-0.1,10,100)
b=np.linspace(-0.1,10,100)
a,b= np.meshgrid(a,b)
c=(a**2)/4+(b**2)/9

fig = plt.figure()

ax = fig.add_subplot(121, projection='3d')
ax.contour(a,b,c, 100)
ax.set_title('3D contour')

plt.show()
Here is the explanation of the some function used in the above example are:
- meshgrid: This is the function of numpy which is basically used to create a rectangular grid out of two given one-dimension arrays representing Matrix Indexing.
- plt.axes(): It is used to create the axis of the object.
- ax.contour3D: It is used to create contour.
- ax.set_xlabel: It is used to label the X-axis.
- ax.set_title: It is used to give a title to the plot.
Output:

- Log in to post comments