There are many datasets are available on the internet but here we have used our own dataset. In the dataset, there are two variables x and y. x is for the size of the house and y is the cost of the house. Here the cost of the house is dependent on the size of the house.
Our aim is to find the line which fits the best if we plot both our variables x and y. So that we can predict the value of y i.e. cost of the house using x i.e. size of the house.
We will create two functions one for calculating the estimated coefficient and another one for plotting the graph.
Follow the given code to create the functions.
Firstly import the following libraries.
import numpy as np
import matplotlib.pyplot as plt
For Calculating Estimated Coefficient:
# we will create a function to estimate the coefficient of x and y values
def estimate(x,y):
  # first we will define the no. of observation
  a=np.size(x)
  #we will calculate the mean of x and y using numpy mean function
  mean_x=np.mean(x)
  mean_y=np.mean(y)
  # we will calculate the sum of square errors
  ss_xy=np.sum(y * x - a * mean_y * mean_x)
  ss_xx=np.sum(x * x - a * mean_x * mean_x)
  # we will calculate the regression coefficent i.e. the value by which the regression line need to be moved.
  b1=ss_xy/ss_xx
  b0=mean_y - b1*mean_x#equation of line
  return(b0,b1)
For Plotting the graph:
# we will create another function to plot the graph
def plot_reg(x,y,b):
  plt.scatter(x,y,color='red', marker='o')
  y_predicted=b[0]+b[1]*x
  plt.plot(x,y_predicted, color='green')
  plt.xlabel('Size')
  plt.ylabel('Cost')
  plt.show()
Declaring datasets and calling both the function:
# Now we will create our data set and call these function
x=np.array([1,2,3,4,5,6,7,8,9])
y=np.array([300,350,500,600,700,900,1000,1200,1500])
b=estimate(x,y)
print('Estimate Coefficients: \nb0={} \nb1={}'.format(b[0],b[1]))
plot_reg(x,y,b)
Output:
Estimate Coefficients:

b0=-2.1551724137931387

b1=157.0977011494253
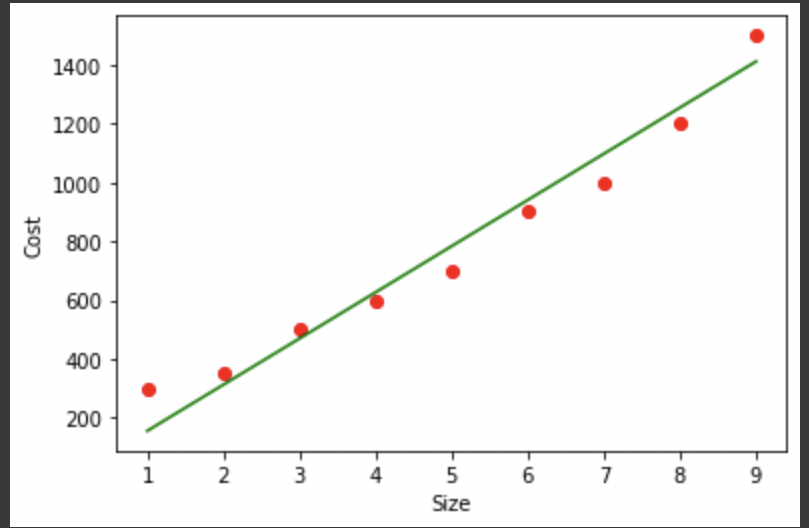
In the graph we can observe that green line is the regression line while red points are the data which was provided while declaring the datasets.
- Log in to post comments