Subtask 3.4: US vs non-US Cross Analysis
This subtask is the last article of this IMDB Case study. In this subtask, you are going to see how the votes for both US and Non-US movies vary among US and Non-US Voters.
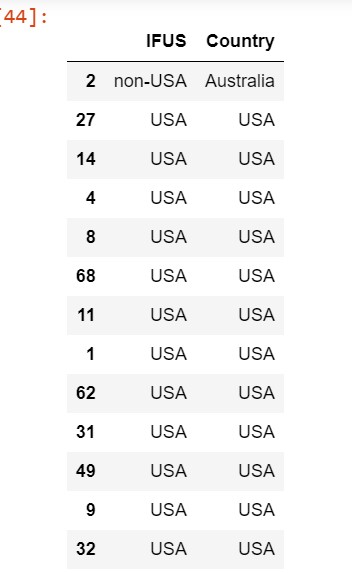
1) Create a column named "IFUS" such that the column must contain the USA if its "Country" is the USA. Also, for countries other than the USA it should contain "non-USA". Follow the code below to perform the same task:
movies['IFUS']=movies['Country'].apply(lambda x : "USA" if x =='USA' else "non-USA")
movies[['IFUS','Country']].head(20)
OUTPUT:
2) Analysis for CVotes:
This part will show you how the number of CVotes for both US and Non-US movies varies for both US and Non-US Voters. This will be performed using the concept of Boxplot of the seaborn library. Follow the code below to perform the same task:
fig, ax=plt.subplots(1,2,figsize=[13,6])

sns.boxplot(data= movies,x='IFUS',
            y='CVotesUS',
            ax=ax[0],
            color='r',
            hue='IFUS')
sns.boxplot(data= movies,x='IFUS',
            y='CVotesnUS',
            ax=ax[1],
            hue='IFUS',
            color='b')

ax[0].set_title('US Voters')
ax[1].set_title('Non-US Voters')

plt.show()
OUTPUT:
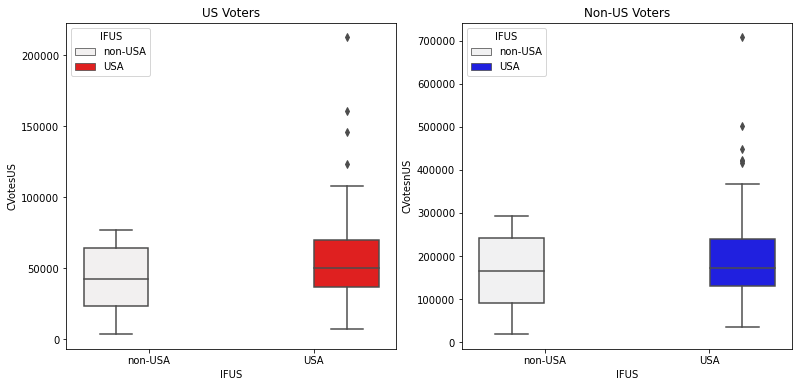
Observations:
1) The median line is higher for US movies than Non-US for both the US Voters and Non-US Voters. Therefore it can be said that 50% of voters(be it the US or Non-US) that vote for US movies is greater than 50% of voters that vote for Non-US.
2)It can be noticed that outliers are present for US movies and not for Non-US movies. The outliers in Boxplot are represented by diamond shape as shown in the diagram above.
3) Analysis for Votes:
As done above for CVotes, you are going to see the same task performed with the Votes column.
OUTPUT:
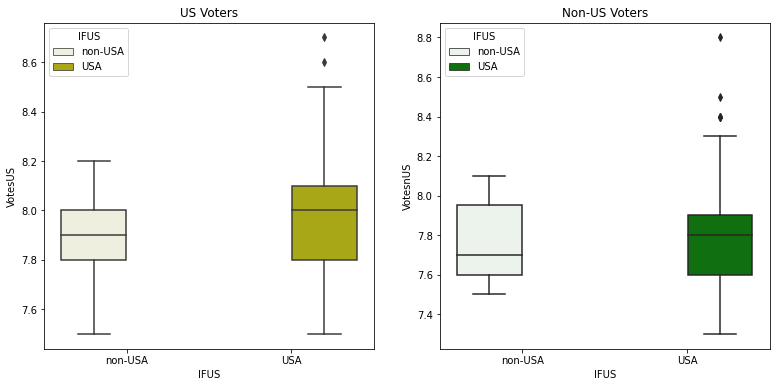
Well, start brainstorming, and try to find out 2-3 inferences/Observations for the above-given output for Votes columns. Perform, this task the same as what we did for CVotes.
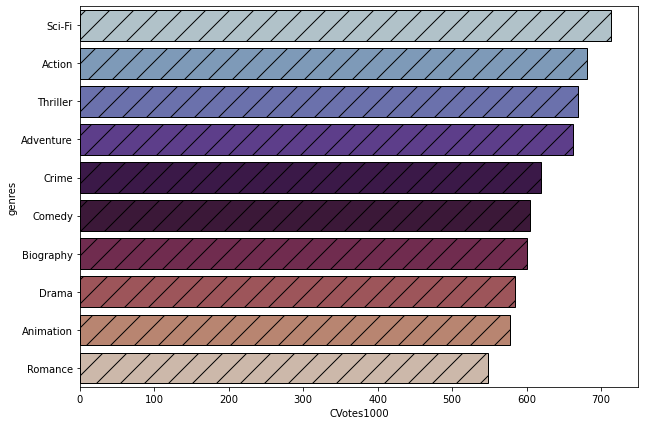
Subtask 3.5: Top 1000 Voters Vs Genres
Now, this is the last portion of this article where we are going to plot a bar graph for Top 1000 Voters Vs Genres. In order to do that, we have a CVotes1000 column in the dataset, that represents the top 1000 voters that voted for the particular movie.
Firstly, you need to arrange genre_top10 in descending order of the CVotes1000 column. Follow the step below to perform the same task:
genre_top10=genre_top10.sort_values(by='CVotes1000', ascending=False)Now, a plotting bar graph using seaborn in order to find Top 1000 Voters Vs Genres you can follow the step below:
# Bar plot
plt.figure(figsize=[10,7])
sns.barplot(y='genres',
            x='CVotes1000',
            data=genre_top10,
            palette='twilight',
            lw=1,
            ec='black',
            hatch='/')
plt.show()
OUTPUT:
- Log in to post comments