A continuous probability distribution is a probability distribution whose support is an uncountable set, such as an interval in the real line.They are uniquely characterized by a cumulative distribution function that can be used to calculate the probability for each subset of the support. There are many examples of continuous probability distributions: normal, uniform, chi-squared, and others.
Types of Continuous Distributions:
Actually speaking, there are many different types of continuous distributions.
1. Beta
2. Triangular
3. Uniform
4. Normal
5. Lognormal and
6. Cumulative
Beta Distribution:
The Beta Distribution
• Is used to describe the uncertainty about the probability of occurrence of an event
• Is based on two shaped parameters
• Uses a range from 0 to 1 and can take several types of shapes.
The following is a sample Beta Distribution:
Triangular Distribution:
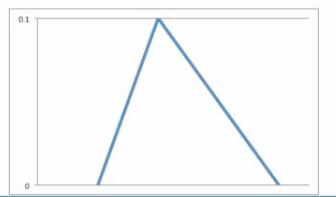
The Triangular Distribution:
• Uses the estimate values based on the 3 point estimates that we covered during the chapter on Interviewing. The Optimistic, Most Likely and Pessimistic values from the 3 point estimate will be used here
• Use only 3 values
• Is used to quantify risks for each of the WBS elements
The following is a sample Triangular Distribution
Normal and Lognormal Distributions:
Normal and Lognormal Distributions are very similar to one another. Their common features include:
• They use Mean and Standard Deviation to quantify risks
• They gather the 3 point estimates, just like the Triangular distribution
• Standard Deviation is usually displayed using either the Normal or Lognormal distributions
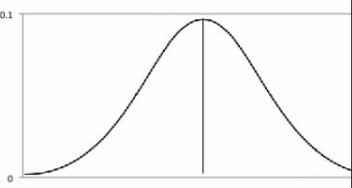
The Normal distribution:
• Is shaped like a bell curve
• The peak of the bell is the Mean/Average
• Is typically used for variables that cluster around the Mean value
• Is used to show confidence level as well as variations
The following is a sample Normal Distribution
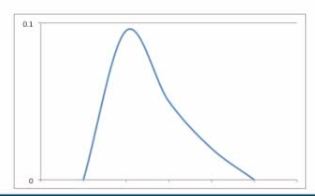
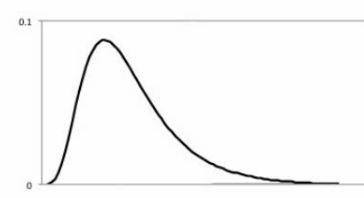
A lognormal distribution uses any random value, and those values plot just like a normal distribution. The following is a sample lognormal distribution. As you can see, the shape is pretty similar to the bell-curve of the normal distribution but distinctly different in terms of the actual shape.
Uniform Distributions
• Are considered to be the simplest form of distributions
• Have all values of the same length which signifies equal probability
• Require you to know the upper and lower limits (the range) in order to use it
• Show scenarios where no obvious value is more likely to happen than the other
For ex: if you were to throw a dice that isn’t rigged in any way, the chances of either of the 6 numbers turning up are equal and hence you will show that using this distribution.
The following is a sample uniform distribution

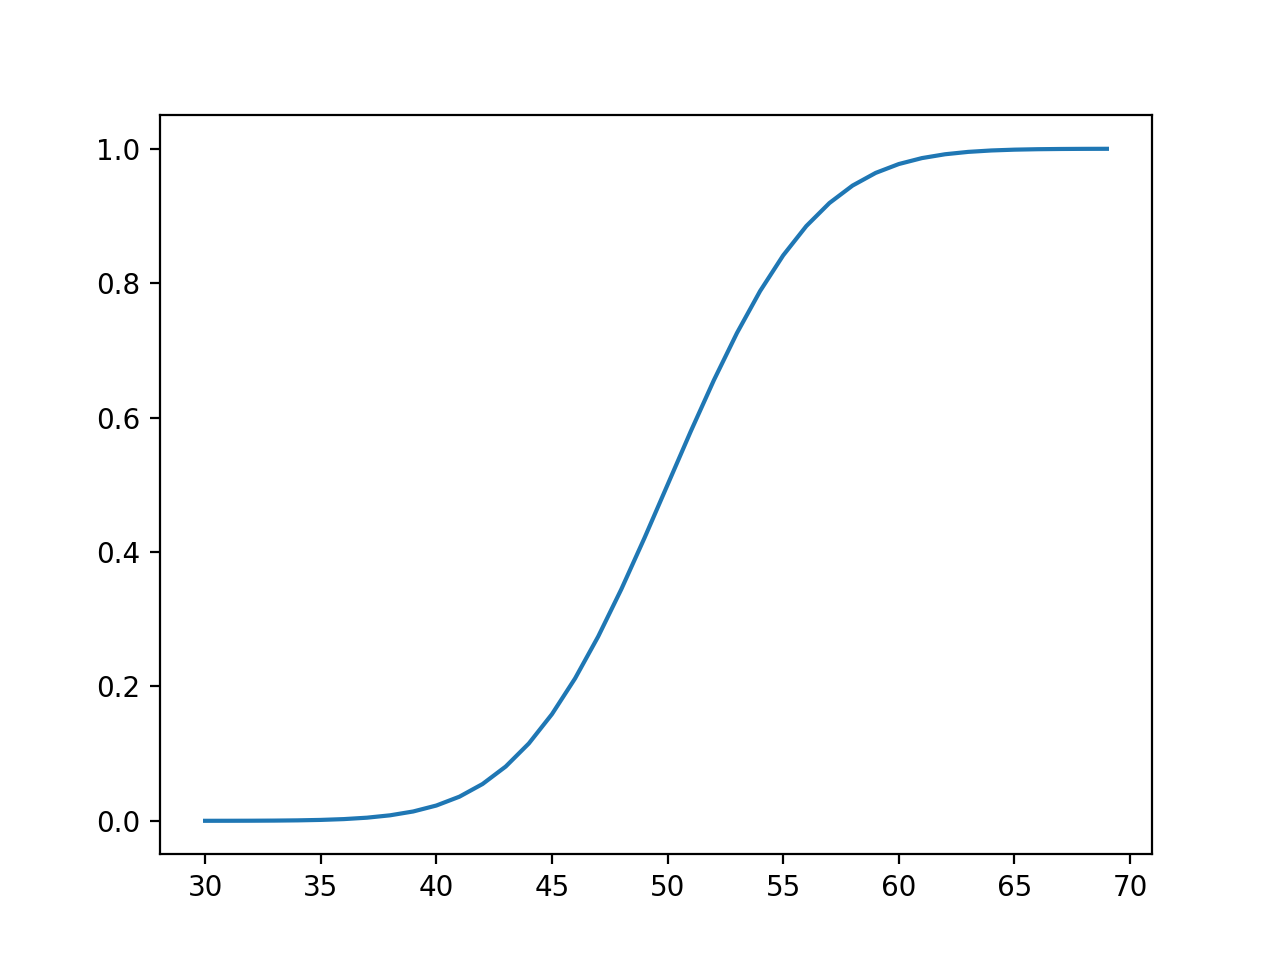
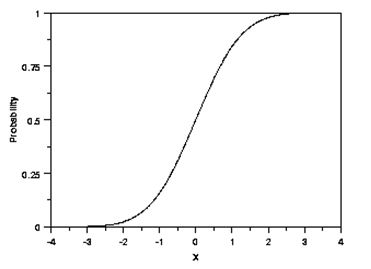
Cumulative Distributions
Cumulative Distributions can convert a set of data values into a distribution that can be analyzed. They are typically S shaped. A sample Cumulative Distribution would look as follows:
Exponential Distributions
The exponential distribution is used to represent the time between the arrival of random events that occur continuously and independently at an average rate.
Gamma Distribution
The Gamma distribution models the amount of time it would take for certain events to occur if the event occurs randomly with an average time between the events. Typically, gamma distributions are used to display waiting times.
- Log in to post comments