When we say twin axes, it means figure can have dual x or y-axes. Matplotlib supports twinx() and twiny() function which is used to create a twin Axes.
twnix() function is used to create dual y-axis and sharing x-axis. Similarly we can use twiny() function to create a second x-axis in the figure while sharing the y-axis.
It is considered to be very useful to have dual x or y axis in a figure. Also when plotting curve with different unit together.
Syntax
#for x-axis
Axes.twinx(self)
#for y-axis
Axes.twiny(self)
Examples
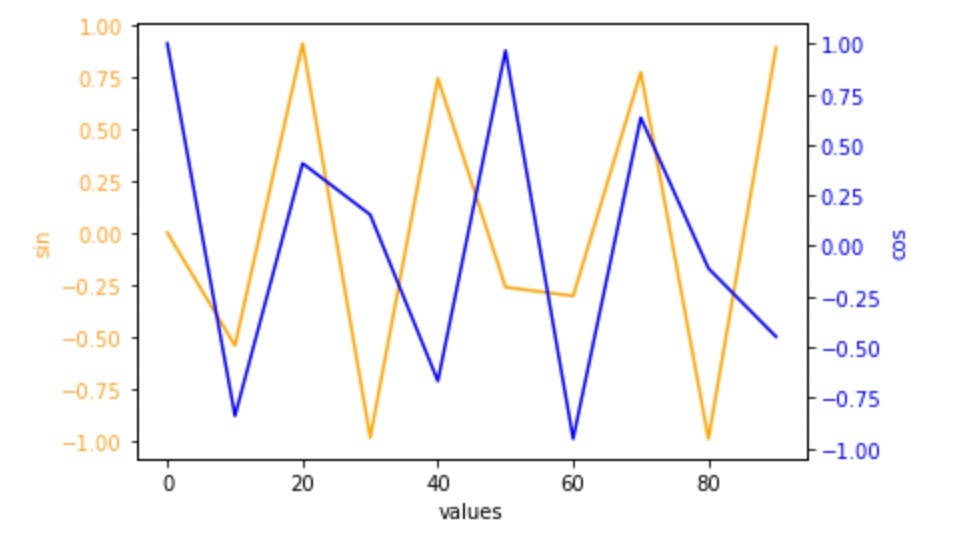
Along x-axis:
import numpy as np
import matplotlib.pyplot as plt
x=np.arange(0,100,10)
data_1=np.sin(x)
data_2=np.cos(x)
fig, ax = plt.subplots()
ax.set_xlabel('values')
ax.set_ylabel('sin', color='orange')
ax.plot(x, data_1, color ='orange')
ax.tick_params(axis ='y', labelcolor ='orange')
ax2= ax.twinx()
ax2.set_ylabel('cos', color = 'blue')
ax2.plot(x, data_2, color = 'blue')
ax2.tick_params(axis ='y', labelcolor ='blue')
plt.show()
Output:
- Log in to post comments