In Matplotlib we can also create a Contour Plot. It is used in civil engineering for topology of a building sight and in mechanical engineering for it can show the stress gradient across part surface.
We can say that contour line of a function of two variable is a function which connects points with the same values.
Contour lines are used e.g. in geography and meteorology.
It is also called as level plots. It is widely used to visualize density, altitudes or heights of the mountain as well as in the meteorological department. Contour plots are way to represent 3-D surface on a 2-D plane. If there are two variables X and Y we can plot then the response Z will be plotted as slice on the X-Y plane due to which contour sometimes are referred as Z-slice.
Matplotlib API contains contour() and contourf() function that draw contour lines and filled contour respectively.
Syntax
plt.contour([X, Y,] Z, [levels], **kwargs)Parameters:
- X, Y: 2-D Numpy Array with the same shape as Z. The coordinate of values in Z.
- Z: The height values over which the contour has to be drawn.
- levels: It defines the number and positions of the contour lines or regions.
Return:
It returns the quadcontour set.
Examples
#import important packages
import matplotlib.pyplot as plt
import numpy as np
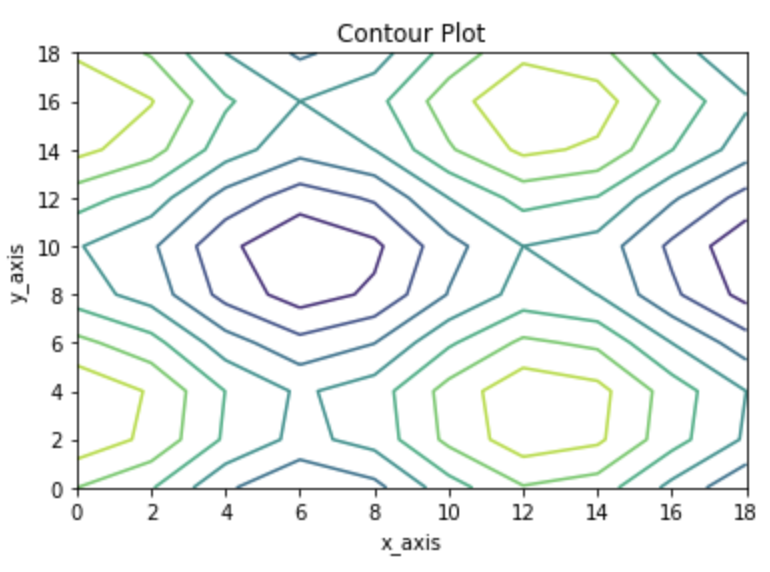
x_axis = np.arange(0, 20, 2)
y_axis = np.arange(0, 20, 2)
# Creating 2-D grid of features
[X, Y] = np.meshgrid(x_axis, y_axis)
fig, ax = plt.subplots(1,1)
Z = np.cos(X/2) + np.sin(Y/2)
#plotting contour lines
ax.contour(X, Y, Z)
ax.set_title('Contour Plot')
ax.set_xlabel('x_axis')
ax.set_ylabel('y_axis')
plt.show()Output:
- Log in to post comments