Clustering in the most common form of unsupervised learning, which the data is unlabeled involves segregating data based on the similarity between data instances. K-Means clustering algorithm is an unsupervised algorithm and it is used to segment the interest area from the background. It clusters, or partitions the given data into K-clusters or parts based on the K-centroids. The algorithm is used when you have unlabeled data(i.e. data without defined categories or groups). The goal is to find certain groups based on some kind of similarity in the data with the number of groups represented by K.
For a certain class of clustering algorithms (in particular K-Means, K-medoids, and expectation-maximization algorithm), there is a parameter commonly referred to as K that specifies the number of clusters to detect. Other algorithms such as DBSCAN and OPTICS algorithm do not require the specification of this parameter. If we talk about K-Means then the correct choice of K is often ambiguous, with interpretations depending on the shape and scale of the distribution of points in a data set and the desired clustering resolution of the user. In addition, increasing K without penalty will always reduce the amount of error in the resulting clustering, to the extreme case of zero error if each data point is considered its own cluster (i.e., when K equals the number of data points, n). Intuitively then, the optimal choice of K will strike a balance between maximum compression of the data using a single cluster, and maximum accuracy by assigning each data point to its own cluster.
If an appropriate value of K is not apparent from prior knowledge of the properties of the data set, it must be chosen somehow. There are several categories of methods for making this decision and Elbow method is one such method.
- K-means converges in a finite number of iterations. Since the algorithm iterates a function whose domain is a finite set, the iteration must eventually converge.
- The computational cost of the k-means algorithm is o(k*n*d), where n is the number of data points, k the number of clusters, and d the number of attributes.
- Compared to other clustering methods, the k-means clustering technique is fast and efficient in terms of its computational cost.
- It’s difficult to predict the optimal number of clusters or the value of k. To find the number of clusters, we need to run the k-means clustering algorithm for a range of k values and compare the results.
K-means is a popular technique for clustering. It involves an iterative process to find cluster centers called centroids and assigning data points to one of the centroids. The steps of K-means clustering include:
1. Identify number of cluster K
2. Identify centroid for each cluster
3. Determine distance of objects to centroid
4. Grouping objects based on minimum distance
K-means clustering is a clustering algorithm that aims to partition n observations into k clusters. There are 3 steps:
- Initialisation – K initial “means” (centroids) are generated at random
- Assignment – K clusters are created by associating each observation with the nearest centroid
- Update – The centroid of the clusters becomes the new mean
## Initialisation

import pandas as pd
import numpy as np
import matplotlib.pyplot as plt
%matplotlib inline

df = pd.DataFrame({
    'x': [10, 20, 30, 76, 27, 35, 25, 45, 40, 50, 80, 52, 44, 53, 60, 61, 64, 733, 70],
    'y': [30, 35, 80, 50, 75, 46, 60, 59, 65, 70, 80, 35, 55, 20, 15, 10, 25, 17, 40]
})


np.random.seed(300)
k = 3
# centroids[i] = [x, y]
centroids = {
    i+1: [np.random.randint(0, 90), np.random.randint(0, 90)]
    for i in range(k)
}

fig = plt.figure(figsize=(7, 7))
plt.scatter(df['x'], df['y'], color='k')
colmap = {1: 'r', 2: 'g', 3: 'b'}
for i in centroids.keys():
    plt.scatter(*centroids[i], color=colmap[i])
plt.xlim(0, 90)
plt.ylim(0, 90)
plt.show() 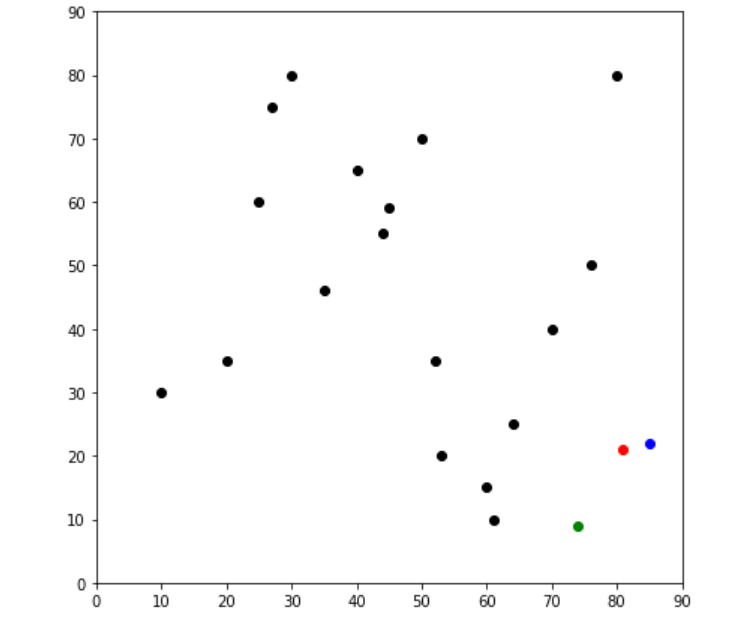
def assignment(df, centroids):
    for i in centroids.keys():
        # sqrt((x1 - x2)^2 - (y1 - y2)^2)
        df['distance_from_{}'.format(i)] = (
            np.sqrt(
                (df['x'] - centroids[i][0]) ** 2
                + (df['y'] - centroids[i][1]) ** 2
            )
        )
    centroid_distance_cols = ['distance_from_{}'.format(i) for i in centroids.keys()]
    df['closest'] = df.loc[:, centroid_distance_cols].idxmin(axis=1)
    df['closest'] = df['closest'].map(lambda x: int(x.lstrip('distance_from_')))
    df['color'] = df['closest'].map(lambda x: colmap[x])

    return df
df = assignment(df,centroids)
print(df.head())
fig = plt.figure(figsize=(7, 7))
plt.scatter(df['x'], df['y'], color=df['color'], alpha=1, edgecolor='k')
for i in centroids.keys():
    plt.scatter(*centroids[i], color=colmap[i])
plt.xlim(0, 90)
plt.ylim(0, 90)
plt.show()
    x   y  distance_from_1  distance_from_2  distance_from_3  closest color
0  10  30        42.327335        31.822005       286.963025        2     g
1  20  35        31.395767        24.528351       276.687750        2     g
2  30  80        28.167738        58.996949       268.131394        1     r
3  76  50        32.640795        44.978217       220.335603        1     r
4  27  75        25.785190        54.767143       270.585374        1     r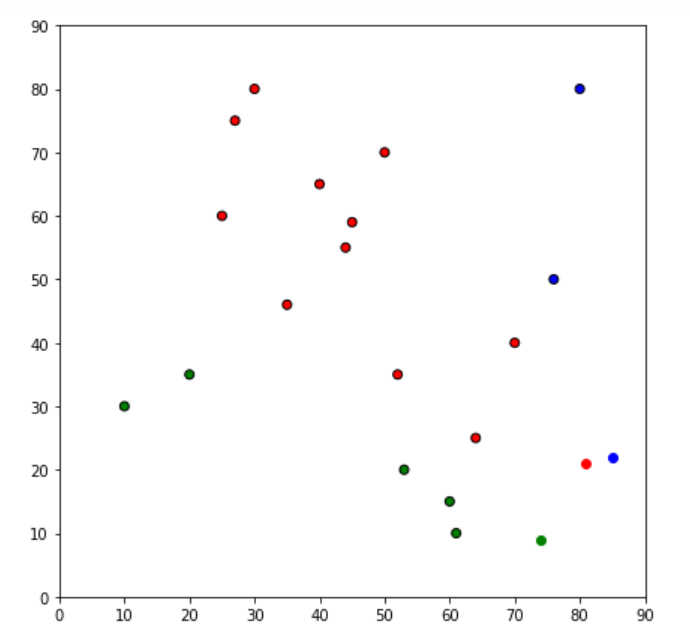
## Update Stage

import copy

old_centroids = copy.deepcopy(centroids)

def update(k):
    for i in centroids.keys():
        centroids[i][0] = np.mean(df[df['closest'] == i]['x'])
        centroids[i][1] = np.mean(df[df['closest'] == i]['y'])
    return k

centroids = update(centroids)

fig = plt.figure(figsize=(7, 7))
ax = plt.axes()
plt.scatter(df['x'], df['y'], color=df['color'], alpha=1, edgecolor='k')
for i in centroids.keys():
    plt.scatter(*centroids[i], color=colmap[i])
plt.xlim(0, 90)
plt.ylim(0, 90)
for i in old_centroids.keys():
    old_x = old_centroids[i][0]
    old_y = old_centroids[i][1]
    dx = (centroids[i][0] - old_centroids[i][0]) * 2
    dy = (centroids[i][1] - old_centroids[i][1]) * 2
    ax.arrow(old_x, old_y, dx, dy, head_width=3, head_length=3, fc=colmap[i], ec=colmap[i])
plt.show()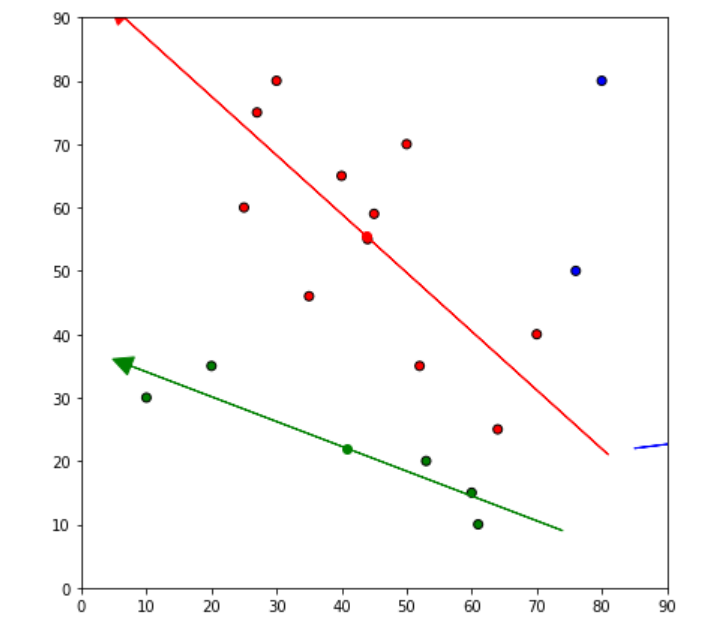
df = assignment(df, centroids)

# Plot results
fig = plt.figure(figsize=(7, 7))
plt.scatter(df['x'], df['y'], color=df['color'], alpha=1, edgecolor='k')
for i in centroids.keys():
    plt.scatter(*centroids[i], color=colmap[i])
plt.xlim(0, 90)
plt.ylim(0, 90)
plt.show()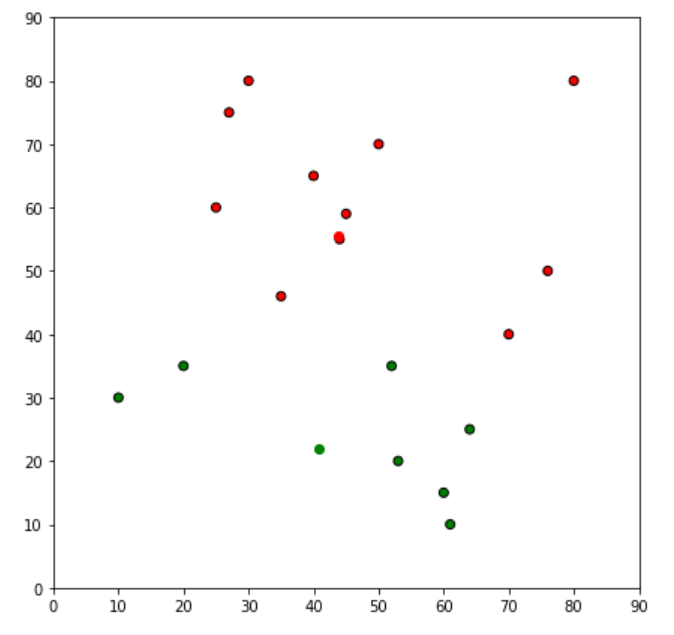
while True:
    closest_centroids = df['closest'].copy(deep=True)
    centroids = update(centroids)
    df = assignment(df, centroids)
    if closest_centroids.equals(df['closest']):
        break

fig = plt.figure(figsize=(7, 7))
plt.scatter(df['x'], df['y'], color=df['color'], alpha=1, edgecolor='k')
for i in centroids.keys():
    plt.scatter(*centroids[i], color=colmap[i])
plt.xlim(0, 90)
plt.ylim(0, 90)
plt.show()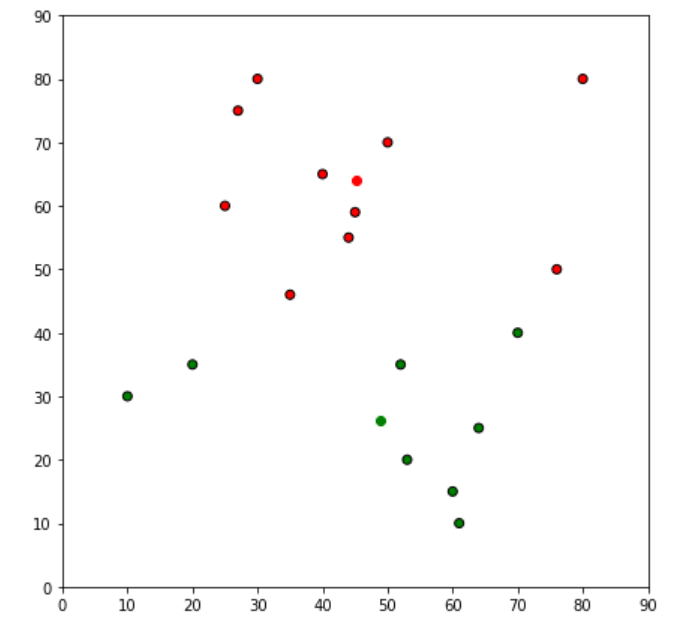
input :
df = pd.DataFrame({
    'x': [10, 20, 30, 76, 27, 35, 25, 45, 40, 50, 80, 52, 44, 53, 60, 61, 64, 733, 70],
    'y': [30, 35, 80, 50, 75, 46, 60, 59, 65, 70, 80, 35, 55, 20, 15, 10, 25, 17, 40]
})

from sklearn.cluster import KMeans

kmeans = KMeans(n_clusters=3)
kmeans.fit(df)
output :
KMeans(n_clusters=3)- Log in to post comments